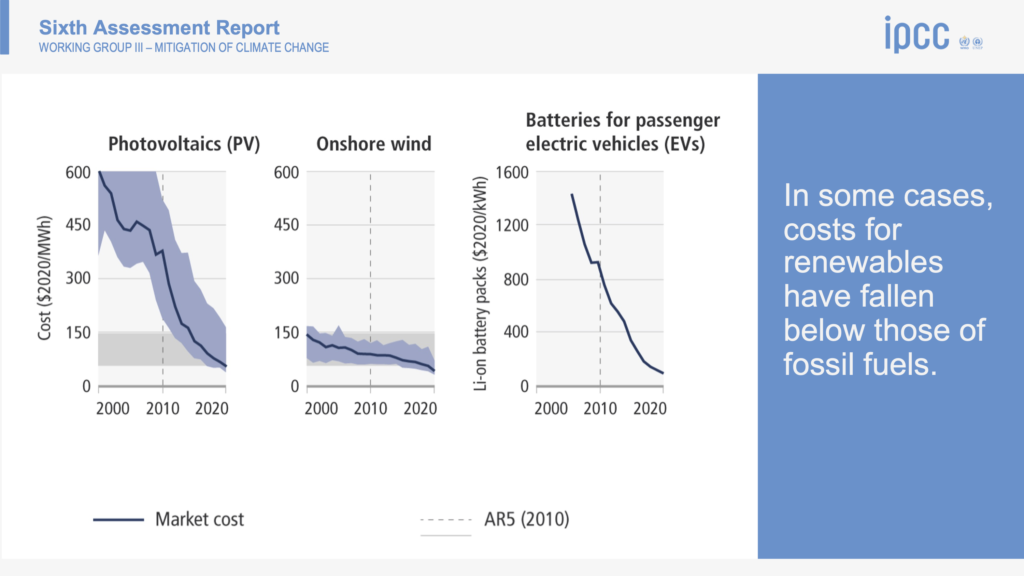
Page 2 of 28

Welcome to the Wilde Capital Management blog

Thanks for visiting our blog. Here you will find a wide range of content discussing market conditions and the world events that affect them, sustainability issues and Environmental, Social and Governance (ESG) oriented investing, and other topics that have a direct bearing on how capital flows around the world and how investing creates and even protects wealth. Please browse the blog at your leisure, and then visit the rest of the site by navigating the menus at the top of the window, or by clicking here.

Wilde Capital Management

WCM Chart of the Week for February 22, 2022

This week we get to take a break from talking about inflation to talk about… inflation. Although, in this case, what effects Russia’s moves on Ukraine might have. Russia’s economy is the 11th largest in the world as measured by nominal GDP, which seems significant until we realize it is smaller than Canada’s and 1/10 the size of China’s. Ukraine is 55th. Where Russia is most consequential in terms of their economy on the world stage is energy – petroleum and natural gas. Europe is a net importer of natural gas, a significant portion but not all of which comes from Russia. They have been increasing LNG imports from the US and Qatar, but that is mostly offset by a steady decline in domestic production. Natural gas is not the only major piece of the European energy portfolio, but it is material. Prices have already been high, and the decision to delay certifying Nord Stream 2 in response to Russian aggression means little relief is on the way. Globally, “OPEC+” has been falling short of targets to increase production post-COVID wind-down and the Ukraine conflict will not help climbing prices for oil either. The West is putting the framework for a new sanctions regime in place but that will mostly be about deciding who takes what share of the economic pain to box out Russia. Rising oil prices have similar effects on the economy as rising interest rates, so we are interested to see how the Fed digests the changing macroeconomic environment and the need to be aggressive on policy rates later in the year. Looking longer term, assuming the priority does not become preventing total war as Putin tries to reassert the borders of the former Soviet Union, we see this moment as a tipping point for Europe to accelerate their transition to a low-carbon future because it is an undeniable security imperative for the EU member states.  [Sources: US Energy Information Administration https://www.eia.gov/todayinenergy/detail.php?id=51258 and McWilliams, B., G. Sgaravatti, G. Zachmann (2021) ‘European natural gas imports’, Bruegel Datasets, first published 29 October, available at https://www.bruegel.org/publications/datasets/european-natural-gas-imports/]

WCM Chart of the Week for February 14, 2022

The February 10th inflation report for January was higher than expected. Key stock market gauges declined and were particularly weak toward the day’s close. Notably, all major inflation segments continue to rise — Services, Goods, and Food  — with the exception of Energy, but oil and gas prices are up so far in February.

The benchmark 10Y UST yield rose above 2.0%, which has been an adverse trigger level for stocks in the recent past. The real yield on US Treasuries is more than -5%, a historic anomaly. Meanwhile, the US Federal Reserve will begin reducing its balance sheet in March. It currently stands at $8.9T, increasing over $5T since the pre-pandemic low of $3.75T, about a 134% increase since the Fall of 2019.  Furthermore, the Fed is set to increase policy rates several times this year, perhaps as many as six times.

It is difficult to envision the Fed backing away from its intent to restrain monetary liquidity, especially considering that inflation trends appear to be gaining momentum. Consumer prices initially began to accelerate in March of last year, rising from 2% to about 4.5%, and had another upswing last Fall through the latest report. Headline inflation, now stands at 7.5%, a 40-year high level that very few, if any, at the Fed have had to deal with in a professional capacity.

Policy conditions are visibly changing, yet the equity market over the past couple of weeks attempted a rally from late January’s bottoms. The recent bid on US stocks could be value seekers, although the market is still fully valued if not overvalued considering a higher rate environment. It could be a response to more and more US states announcing a wind-down of COVID-era policies, or simply that capital needs a place to land and US stocks are more attractive than international equity markets or global bonds.

Absent a meaningful catalyst (we are still looking) we do not anticipate a sustained rally and expect the general trend of US equity prices to be range bound to downward. Investors must come to grips with a tighter monetary policy environment, higher interest rates and inflation. We note that other major central banks, notably the BOE, have increased policy rates, and the ECB is publicly debating the need to address inflationary trends on the European continent.  And, many emerging market CBs have already embarked on a tightening cycle. [chart data from US BLS © 2022]

WCM Chart of the Week for February 8, 2022

The market, in our view, is trying to come to grips with a less accommodative yet still supportive monetary and fiscal policy environment. Federal Reserve policy is dominant at this moment, since it appears fiscal policy progress has stalled until the mid-term elections and perhaps beyond. The Fed is unlikely to turn away from its recent pivot towards being less “dovish”, which in light of recent inflationary trends is still is a far cry from an aggressively “hawkish” stance.

It seems probable the market will re-test the lows of January 24th over the coming days or weeks, and from there we will ultimately see from which way the equity market breaks. The recent intra-day volatility was reminiscent of some of the price action during the financial crisis, particularly around the 2008 election. When it appeared that President Obama would easily win, the S&P 500 rallied over 18% from October 27th to election day November 4th. With deep uncertainty about who would fill the new President’s cabinet and what steps they would take to address the worsening crisis, the S&P 500 subsequently fell nearly 33%. The market ultimately bottomed when Timothy Geithner, Obama’s most important new cabinet appointee at that moment (Sec. Treas.), announced the deployment of the TARP funds. There are certainly differences between 2008-2009 and now, most notably the health of the financial sector. However, the market fears uncertainty and that is a common thread between now and then. Another more tenuous thread, but one worth watching, is the speculative bubble in digital assets that has already partially ruptured, and the run-up in residential real estate in part fueled by loose lending practices. Today’s uncertainty is primarily around what the future holds in a less accommodative monetary and fiscal environment. Economic activity, while still growing, appears to be slowing and high inflation persists, prompting concerns about the potential for stagflation. [chart: Wilde Capital Management © 2022, data from Standard & Poor’s 500 Index]

WCM Chart of the Week for January 18, 2022

Evidence of consumer price pressure abound ranging from rising food to energy to consumer staples. Overall, US consumer prices rose over 7%, a growth rate the US has not faced since the 1980s. There are several well-documented reasons why prices have risen so rapidly, including the pandemic-forced economic shutdowns and supply chain disruptions of the past two years. How long will inflationary conditions persist, and will it become structural? Prior to the pandemic, the US was in a benign inflationary environment. Then, disinflation resulting from government-mandated shutdowns across the country suppressed prices. The annual change in US CPI averaged 1.4% from April 2020 to April 2021. The current CPI reading on December 31, 2021 is based off pandemic nadir levels, and the base effect may lead to higher “headline” inflation in the months ahead. However, if annual gains in consumer prices fail to keep pace with the high inflation trends of 2021 [which include 2020’s low base effect], forward looking inflation could moderate. Capital markets will likely remain on edge, and the US Federal Reserve will be challenged balancing appropriate monetary policy against inflationary trends that may prove temporary, but also may not. (chart © 2022 Wilde Capital Management, data from Bureau of Labor Statistics)

WCM Charting the Way to 2022

Since March 2020 the US federal government has injected an enormous amount of stimulus into the economy. There have been seven stimulus and reliefpackages ranging from the original Coronavirus Preparedness and Response Supplemental Appropriations Act to The Families First Act to the CARES Act to The Consolidated Appropriations Act and the most recent American Rescue Plan. Even without Build Back Better, this fiscal expenditure legislation amounts to nearly $15 trillion over the life of the legislation with more on the way with the new infrastructure plan. The Federal Reserve has also injected a tremendous amount of liquidity in the system by expanding its balance sheet by $4.5 trillion since March 2020 while maintaining a benign interest rate and regulatory environment. The combined government stimulus over the past twenty months amounts to over 83% of current US GDP (as of end Q3 2021). Compared to the recessionary bottom in 2020, the same stimulus is nearly 100%. By contrast, the 2009 TARP expenditure amounted to about 5% of US GDP at the time. We do not have to look far to see from where upward pressure on asset prices and inflation comes.

WCM Chart of the Week for December 6, 2021

Through the end of November, the S&P 500 has delivered a robust 23.2% year-to-date total return, piling on to2020’s impressive full-year 18.4% clip. On its face, such strong stock market results would seem implausible given the disruptive forces of the pandemic, the multiple variants and building inflationary pressure here and abroad. The S&P 500 reached its pandemic bottom on March 23, 2020 and since then, the 20 month-end observations of rolling annual returns (shown on the chart) have averaged over 25.8%. To place that figure in context, the long-term average annual return since inception in 1987 is 12.38%. The low “base effect” climbing up from the pandemic bottom contributed to the relative strong % gains over the past twenty months, but there are also significant macro factors that have supported a booming US stock market that may prove to be headwinds going forward. [chart data courtesy Standard & Poors, Bloomberg LP © 2021]

WCM Chart of the Week for November 29, 2021

Consumer prices in the US are observably on the rise across a broad array of products and services. The Federal Reserve’s preferred inflation gauge, the PCE, last week registered a 4.1% annual increase, well above the Fed’s target. The causes of higher prices are well known, ranging from supply chain bottlenecks to raw material scarcity to higher energy costs to a shortage of transportation personnel. Adding to the inflationary mix is strength in the US dollar which has recovered over 6% according to the Bloomberg US Dollar index, comprised of a basket of major currencies. The dollar has recovered to pre-pandemic levels and could strengthen further as the Fed begins to reign in liquidity towards the end of 2022 if not earlier. Continued dollar strength could provide some inflationary relief in the form of lower import prices and could be justified given strong US economic growth and the interest rate differential between the US bonds and the rest of the world. As this week’s chart illustrates though, currency movements are notoriously difficult to predict. [chart courtesy Bloomberg LP © 2021]

Charting COP-26 — I know you are disappointed

“I know you are disappointed”. That was UN Secretary General Gutteres’ message to “young people, indigenous communities, women leaders, and all those leading the charge on climate action” as COP-26 adjourned in Glasgow. From the perspective of those four groups, representing rather a large percentage of the planet’s population, “disappointed” might be the diplomatic understatement of this century as they cling to the edge of an existential cliff. Can an institution that by design is meant to move (extremely) slowly and deliberately and with total consensus actually address something with this much urgency?

Perhaps the issue is one of framing. From the UN’s perspective, if they were presented with an international conflict where food systems were to collapse, millions of lives were to be at risk, millions were to become refugees, hundreds of billions of dollars of infrastructure were to be destroyed, and this catastrophe would know no borders and respect no nation, law, or military might, what would it do? Guns pointed at each other is actually one of many societal byproducts of climate change, but for this thought experiment we should focus on the magnitude of devastation and hardship that is happening without a shot being fired. If slowing things down is the UN’s true nature, what can it slow down to forestall the full impact of this emerging catastrophe while it finds a permanent fix? What resources would it mobilize?

197 nations are signing the “Glasgow Climate Pact”, but the two most populous countries insisted on a language change from “phase out” to “phase down” coal. That fundamentally changes the coal question from one of “when” to one of “if”. Again, looking at other activities that pose imminent threat to life and land that bring UN involvement, say, nuclear weapons development or massing troops on a national border, the distinction between “phase out” and “phase down” would be of monumental import. We are mired in process over outcome.

On the UN’s news feed for November 3rd, they reported “It’s ‘Finance Day’ at COP26, and the spotlight is on a big announcement: nearly 500 global financial services firms agreed on Wednesday to align $130 trillion – some 40 per cent of the world’s financial assets – with the climate goals set out in the Paris Agreement, including limiting global warming to 1.5 degrees Celsius.” At the UN above all other institutions, words mean something. What does “align” mean? Is this another “phase down” vs. “phase out” situation? For what we do on a regular basis as allocators of capital within that ecosystem of global financial services firms, we are forced to ask if this is a commitment to the largest greenwashing campaign in history. As we have written and spoken about repeatedly, we are looking to see whether this is the first step of many along a path to more sustainable capital allocation, or window dressing to manage optics. Intentionality is everything.

As noted previously, it is going to take the mobilization of private and not government capital to reach the intensity and scale of development necessary to forestall the worst effects of the climate crisis. Governments, who already failed to live up to their prior pledges to deploy $100 billion annually, should instead pivot to facilitating marketplaces and lowering barriers and allow the free market to do its work. Shifting capital to a regenerative model for food, energy, water, and infrastructure could unlock an economic boom and broaden participation in a way which would be historic in defining the 21st century.

Charting COP-26 — Is that a pie in the sky?

Today at COP-26 we received a declaration entitled “INTERNATIONAL AVIATION CLIMATE AMBITION COALITION”. Commercial aviation is a non-trivial contributor to GhG emissions. The widely cited statistic is that, if the industry were a nation, total output would rank it 7th after Germany. From a climate policy point of view though, we are asking whether the focus is correct on the part of policymakers and signatory nations. The International Civil Aviation Association (ICAO) already set goals a decade ago of improving efficiency by 2% per year, which was not out of line with historical trends. Improvements in jet engine efficiency along with innovations in avionics and lighter airframes have led to steady increases in efficiency per passenger seat for decades. It makes absolute commercial sense because of the amount of the economics of air transportation consumed by fuel costs. Each generation of aircraft upgrades provides significant improvements. Fuel burn for new aircraft fell by nearly half from 1968 to 2014. We are questioning the focus because unlike other industries like power generation, there are no viable alternatives on the visible horizon. Coal plants can be decommissioned in favor of natural gas, or going all the way to wind, solar, hydro, etc. ICE cars and trucks can be replaced with EVs. There is no EV plane (yet). The industry is doing its part in terms of innovation and of course there is room to do more. The real burden is behavioral though, and yet that is nowhere to be found in the COP statement. There are commitments to alternative fuels and technologies, but nothing about curbing unnecessary air travel, making more efficient aircraft affordable for developing nations rather than selling them hand-me-down decades-old aircraft, or changing the business mix to favor flying larger and more efficient airframes over the explosion in use of small, less efficient, commuter aircraft for many routes. [chart from International Council on Clean Transportation, Fuel Efficiency Trends for New Commercial Jet Aircraft: 1960 to 2014, Anastasia Kharina, Daniel Rutherford, Ph.D.]

« Older posts Newer posts »