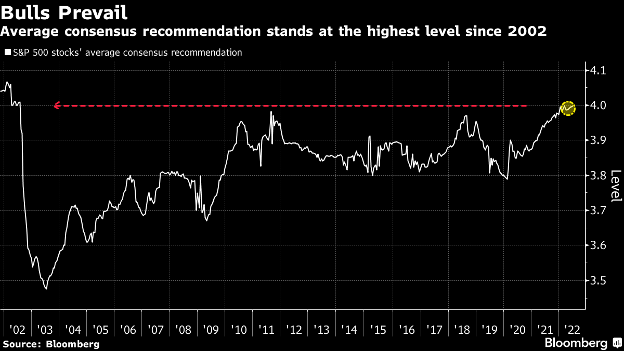
This chart comes to us from a Bloomberg article citing their proprietary US sell-side stock analyst ratings which have not been more bullish since 2002 (their scale is 1 to 5 with 1 being equivalent to a “sell” recommendation and 5 a “buy”). On the surface, they seem optimistic about equities, but we evaluate this data differently. From the end of June 2002, the S&P 500 fell (an additional) 21.1% until it ultimately bottomed at 776.76 on October 9, 2002. The index had previously fallen 33.3% from its peak on March 24, 2000 until June 30, 2002. There are several differences between 20 years ago and today. The S&P was even more top heavy with technology companies back then and there tended to be more gray hair among the analyst community than there is today. Throughout the past twenty years, our observation has been that company and industry analysts have tended to focus on micro issues and management guidance rather than macro forces that are actually dominating the path of equity markets. If the Es catch up with the Ps on the downside, which seems likely with rising rates and petroleum prices, a tight labor market and continuing supply chain issues, we will likely see chastened analysts quickly and belatedly revising down their ratings after the damage is done and the outlook for equities actually is improving.