Category: Equities (Page 1 of 4)

WCM Chart for June 30, 2022

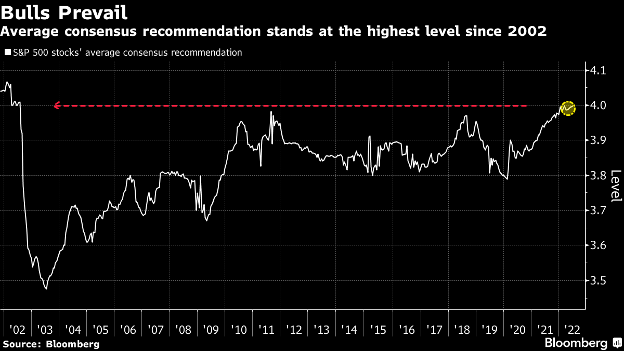
This chart comes to us from a Bloomberg article citing their proprietary US sell-side stock analyst ratings which have not been more bullish since 2002 (their scale is 1 to 5 with 1 being equivalent to a “sell” recommendation and 5 a “buy”). On the surface, they seem optimistic about equities, but we evaluate this data differently. From the end of June 2002, the S&P 500 fell (an additional) 21.1% until it ultimately bottomed at 776.76 on October 9, 2002. The index had previously fallen 33.3% from its peak on March 24, 2000 until June 30, 2002. There are several differences between 20 years ago and today. The S&P was even more top heavy with technology companies back then and there tended to be more gray hair among the analyst community than there is today. Throughout the past twenty years, our observation has been that company and industry analysts have tended to focus on micro issues and management guidance rather than macro forces that are actually dominating the path of equity markets. If the Es catch up with the Ps on the downside, which seems likely with rising rates and petroleum prices, a tight labor market and continuing supply chain issues, we will likely see chastened analysts quickly and belatedly revising down their ratings after the damage is done and the outlook for equities actually is improving.
WCM Chart of the Week for February 8, 2022

The market, in our view, is trying to come to grips with a less accommodative yet still supportive monetary and fiscal policy environment. Federal Reserve policy is dominant at this moment, since it appears fiscal policy progress has stalled until the mid-term elections and perhaps beyond. The Fed is unlikely to turn away from its recent pivot towards being less “dovish”, which in light of recent inflationary trends is still is a far cry from an aggressively “hawkish” stance.

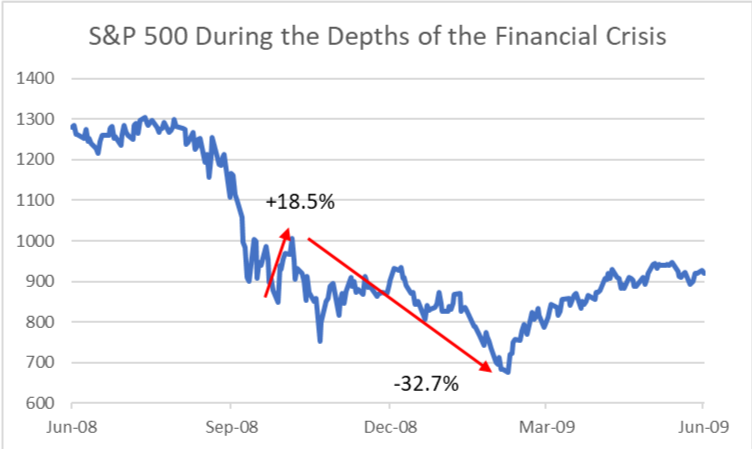
It seems probable the market will re-test the lows of January 24th over the coming days or weeks, and from there we will ultimately see from which way the equity market breaks. The recent intra-day volatility was reminiscent of some of the price action during the financial crisis, particularly around the 2008 election. When it appeared that President Obama would easily win, the S&P 500 rallied over 18% from October 27th to election day November 4th. With deep uncertainty about who would fill the new President’s cabinet and what steps they would take to address the worsening crisis, the S&P 500 subsequently fell nearly 33%. The market ultimately bottomed when Timothy Geithner, Obama’s most important new cabinet appointee at that moment (Sec. Treas.), announced the deployment of the TARP funds. There are certainly differences between 2008-2009 and now, most notably the health of the financial sector. However, the market fears uncertainty and that is a common thread between now and then. Another more tenuous thread, but one worth watching, is the speculative bubble in digital assets that has already partially ruptured, and the run-up in residential real estate in part fueled by loose lending practices. Today’s uncertainty is primarily around what the future holds in a less accommodative monetary and fiscal environment. Economic activity, while still growing, appears to be slowing and high inflation persists, prompting concerns about the potential for stagflation. [chart: Wilde Capital Management © 2022, data from Standard & Poor’s 500 Index]

WCM Chart of the Week for December 6, 2021

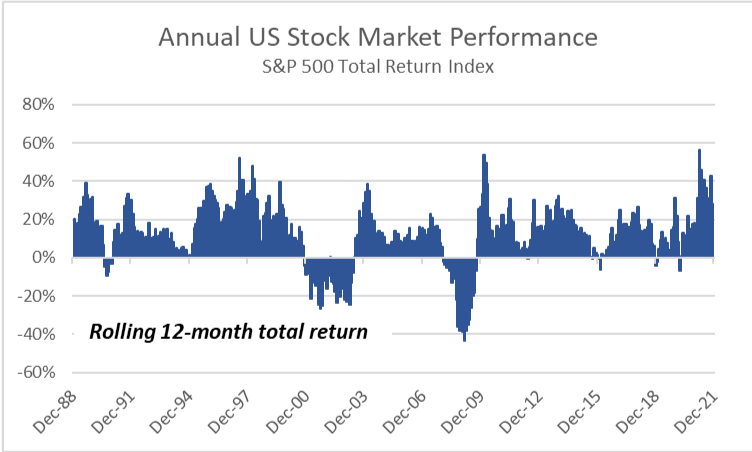
Through the end of November, the S&P 500 has delivered a robust 23.2% year-to-date total return, piling on to2020’s impressive full-year 18.4% clip. On its face, such strong stock market results would seem implausible given the disruptive forces of the pandemic, the multiple variants and building inflationary pressure here and abroad. The S&P 500 reached its pandemic bottom on March 23, 2020 and since then, the 20 month-end observations of rolling annual returns (shown on the chart) have averaged over 25.8%. To place that figure in context, the long-term average annual return since inception in 1987 is 12.38%. The low “base effect” climbing up from the pandemic bottom contributed to the relative strong % gains over the past twenty months, but there are also significant macro factors that have supported a booming US stock market that may prove to be headwinds going forward. [chart data courtesy Standard & Poors, Bloomberg LP © 2021]

A WCM Seasonal Chart for October 15, 2021

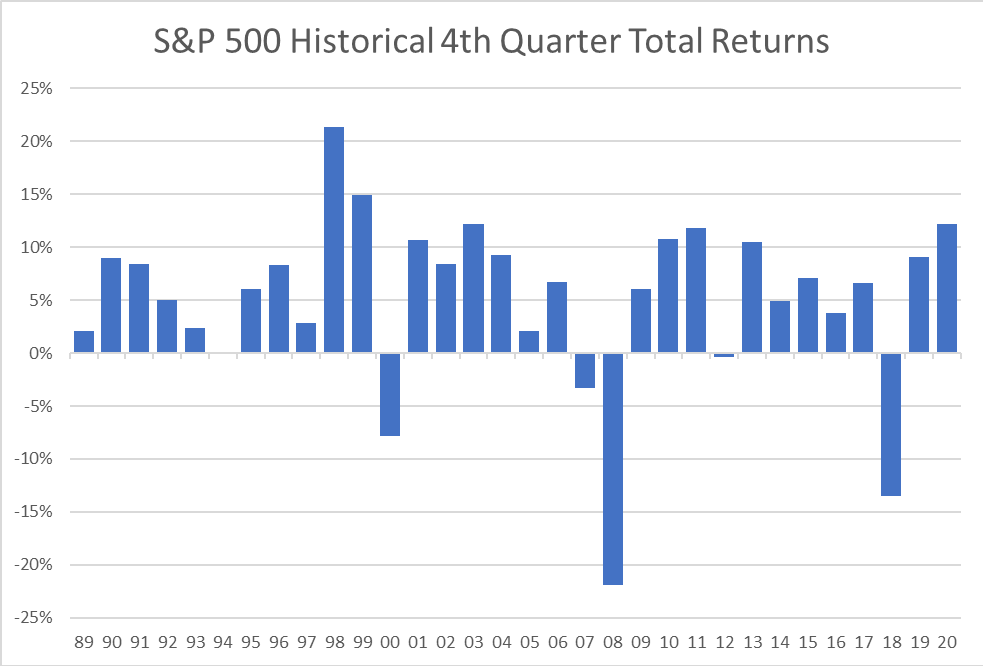
The total return of the S&P 500 tends to be positive in the final quarter of the year, averaging nearly 5.2% since Q4 of 1989. The worst final quarters of the year occurred during the technology bubble, the financial crisis and most recently 2018. Let’s look at today’s headwinds. Inflation, which is near universal across the economy, works like a broad tax on everyone. Price increases in many segments of the economy are outpacing wage growth, and that is impacting consumption which makes up about 70% of GDP. Supply chain issues will likely persist into next year and perhaps beyond, continuing to pressure prices. Next, the Fed. Their actions or inactions will be scrutinized and probably criticized for years. Tapering will start soon, but liquidity and monetary support will still be positive, just less so. It is doubtful, even with so many Fed seats open, that President Biden will appoint hawks in this environment, so we expect that will keep the Fed accommodative for longer and rate hikes pushed out further. In the Fall of 2018, our last “bad” Q4, the Fed was in balance sheet reduction mode and in the midst of raising policy rates when Powell remarked that they were “not near interest rate neutrality” causing a rout in equities worldwide. Three years and a more seasoned Powell later means we do not expect the same rhetorical mistake will be repeated. We also need to watch the ECB. Inflation could be here for longer and that would fuel ongoing volatility. Bad for bonds but not necessarily stocks. For us, even with additional volatility, equities remain the default asset class at least over the next few quarters. [chart WCM © 2021, data from Bloomberg LP]

WCM Chart of the Week for April 12, 2021

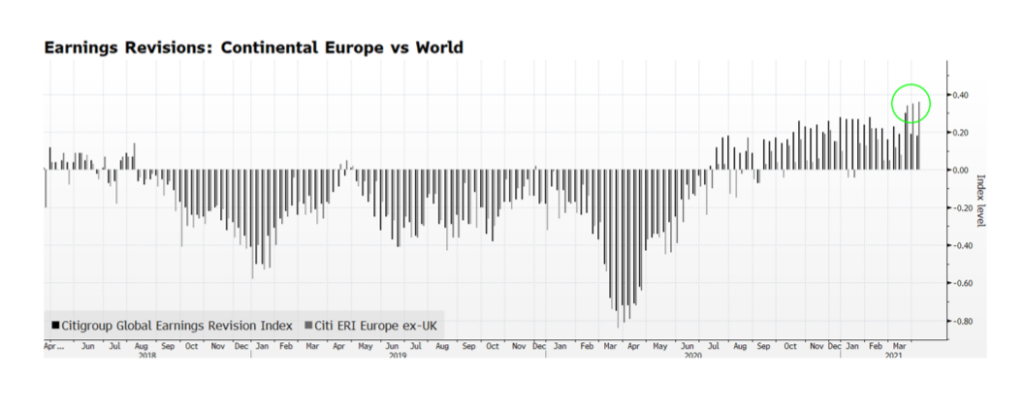
According to Citigroup’s Earnings Revision Indices, Eurozone earnings are far outpacing the rest of the world, and equity prices are gaining on a relative basis as well. Year-to-date through April 12th, Eurozone shares still trail the S&P 500 total return in US dollar terms 7.2% to 10.2%. Equity investors may be signaling that even in the midst of reimplemented economic shutdowns and virus spikes, the worst may be over on the Continent and more prosperous conditions are on the horizon. There are also reasons to be optimistic about the region’s stocks — they trade at favorable valuations compared to US equities and the ECB is continuing to be highly accommodative making fixed income alternatives unattractive. If Eurozone equities can continue to rally and broaden the global advance of stocks it would likely provide a boost of confidence for investors worldwide. [chart courtesy Bloomberg LP, Citigroup © 2021]

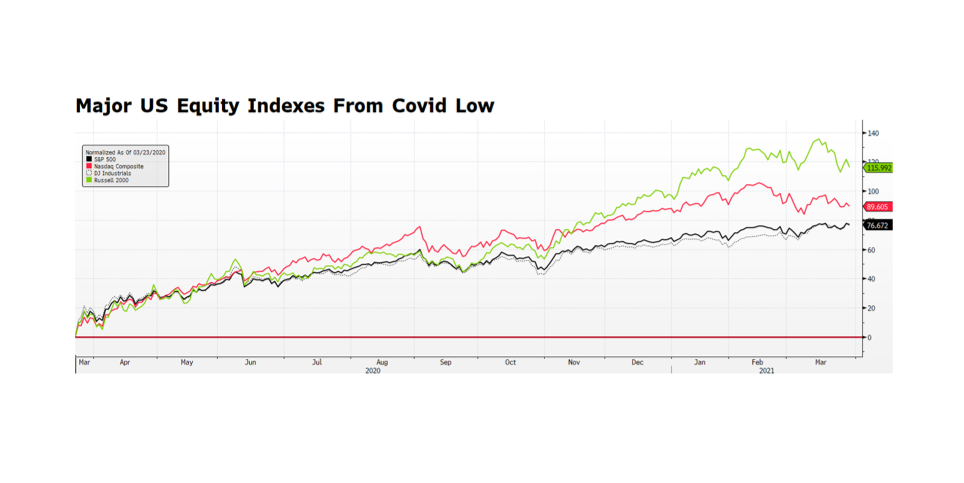
WCM Chart of the Week for March 29, 2021

It has been just over a year since stocks around the world began to recover from the pandemic-driven sell off. Stocks in the US found their bottom around March 23, 2020.  Since then, returns have been unusually strong with small cap stocks leading the way with the Russell 2000 Index up 115% and the Nasdaq Composite up nearly 90%. The rebound is not so surprising given the amount of fiscal and monetary stimulus that has been injected into the economy over the past year. The fiscal stimulus including the CARES Act, PPP, Consolidated Appropriations and the American Rescue Plan amount to over $5.4 trillion, while the Federal Reserve has expanded its balance sheet by nearly $3.6 trillion. Taken together, the stimulus efforts amount to over 43% of 2020 US GDP with even more potential fiscal plans. To place the astronomical stimulus in context, the Bureau of Economic Analysis (BEA) announced on March 25th that US GDP contracted 3.5% in the full year 2020. The BEA also announced its Q4 2020 GDP estimate indicating expansion at a 4.3% pace following Q3 growth of 33.4%. With the economy clearly on a strong path to recovery, we see continued stimulus as potentially overkill, at least in market terms, and the excess liquidity will likely produce further gains in stocks in the months ahead. [chart courtesy Bloomberg LP © 2021]

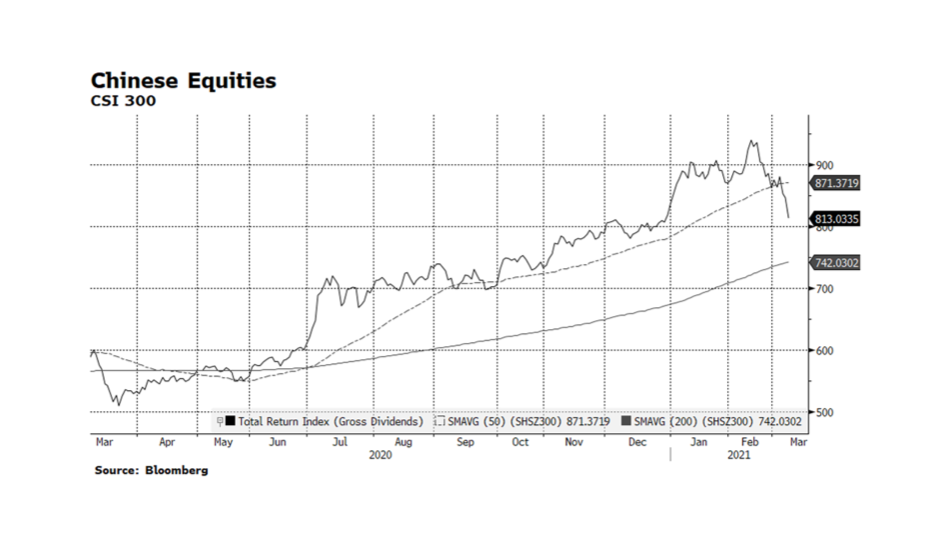
WCM Chart of the Week for March 8, 2021

According to the widely followed Shanghai Shenzhen CSI 300 Index, Chinese equities have abruptly fallen into correction territory, declining over 12% from their near-term peak on February 10th. The consensus is the correction was overdue given extended valuations of the dominant companies in the index. Historically, Chinese share prices have been volatile but tolerant investors have been rewarded with strong relative returns. However, this rout is concerning because market participation within China has been declining since late Summer 2020. Chinese equities did help lift share prices across Asia, broadening the global stock market rally beyond just US technology companies. But, we are now seeing some of the flipside of this correlation as price action in Chinese stocks is adversely impacting broader Emerging Market equities which have been among the world’s top performing assets so far this year. [chart courtesy Bloomberg LP © 2021]

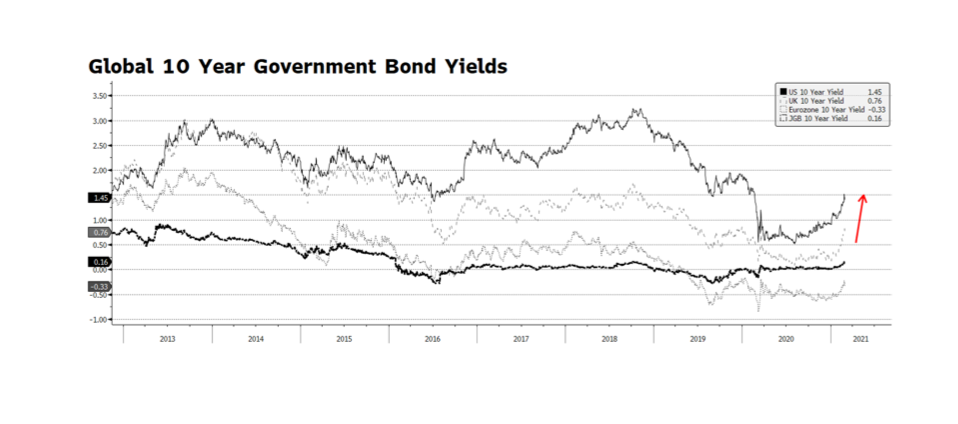
WCM Chart of the Week for March 1, 2021

Equity markets around the globe were on edge as February came to a close. The technology-laden NASDAQ fell nearly 7% from an all-time high on February 12th. The weakness in equity prices came despite very accommodative comments from US Federal Reserve Chairman Jerome Powell during his scheduled two-day Congressional testimony last week. Equity markets became unnerved as government bond yields began to rise at an accelerated pace in the US, Eurozone and particularly the UK. Benchmark interest rates have been rising since the beginning of this year and US interest rates have been climbing since last Summer signaling expectations of improving economic conditions in the months ahead. As long as the rate environment increases gradually, gains can continue in equity markets. But, as we witnessed over the past few weeks, a steep ascent in market interest rates will have an expected adverse impact on risk assets. [chart courtesy Bloomberg LP (c) 2021]

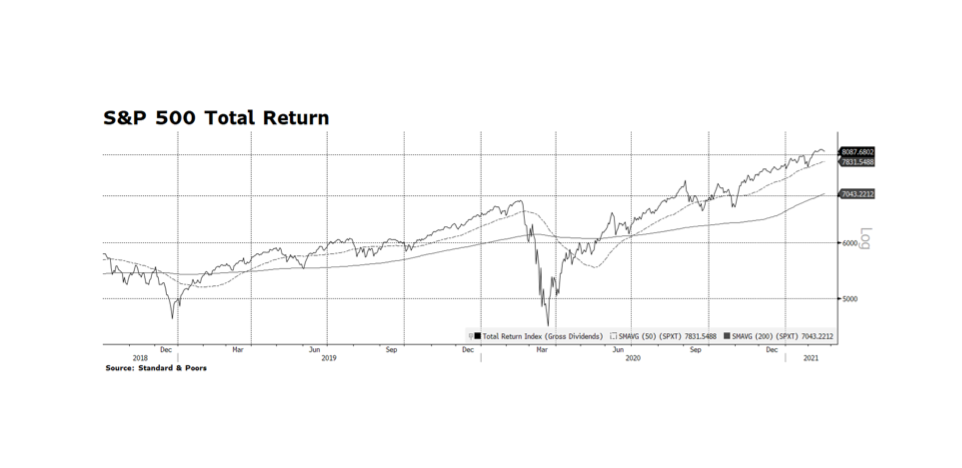
WCM Chart of the Week for February 22, 2021

As we pass through the 12-month mark of the pandemic-caused rout in equities and risk assets across the world, investors are concerned about stretched stock market valuations, tight investment grade and high yield credit spreads, rising interest rates and poor labor market conditions. As of February 22nd, the one-year total return on the S&P 500 is just over 18% which is significant by any historical measure. As the next month or so passes, and as long as equity prices stay near where they are now, trailing returns are likely to grow even stronger as the anniversary of the March 23rd market bottom approaches. This may provide an additional psychological boost for investors as more stimulus is poured into the economy. Our concern is that the tremendous forthcoming stimulus now being debated in Congress might not be fully needed, or at least might not be properly apportioned. The stimulus may propel stocks higher here and abroad but may force the US Fed, which remains the dominant force in global capital markets, to reign in liquidity sooner than the market anticipates. [chart courtesy Standard & Poors and Bloomberg LP ©2021]

WCM Chart of the Week for February 15, 2021

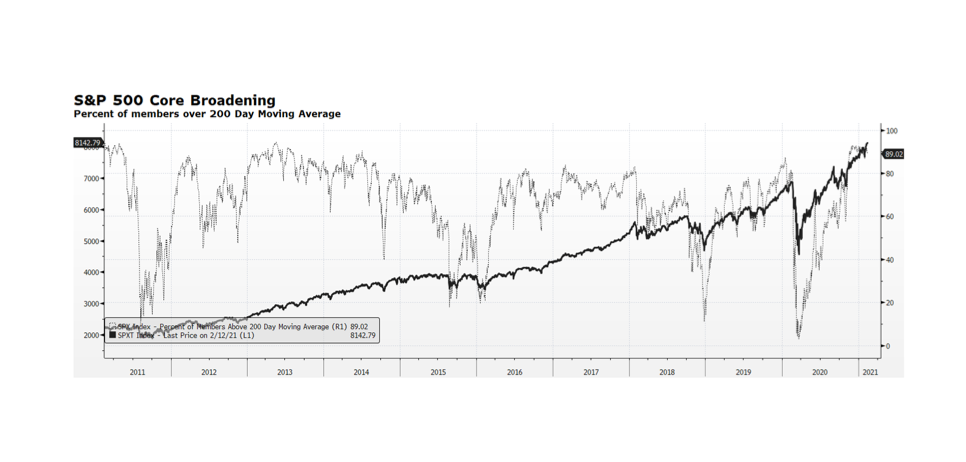
Investors are concerned that US equity market levels are reaching new all-time highs and valuation readings continue to be stretched. Several months ago narrow leadership within US stocks was the reason to justify underexposure to the asset class. Market participation has broadened considerably since the pandemic-caused nadir of 2020 as equity prices have climbed. One measure of greater market participation is the percentage of stocks trading above their long-term trends, depicted as the dotted line in the chart, revealing 89% of the S&P 500 universe trading above their 200-day moving average. While the current level of participation is high, it can persist for prolonged periods as it had over the past decade. The 2010s were a period of slow economic and job growth post-financial crisis, and yet equity prices delivered robust gains during times of high participation, only temporarily interrupted by bouts of Euro-related uncertainty, the US Treasury debt downgrade, and the “Taper Tantrum”. Given the amount of monetary and fiscal support pledged by the Fed and Congress, our sense is that US stock prices could maintain their general upward trend even in the face of more near-term challenges. [chart courtesy Bloomberg LP, © 2021]

« Older posts