Author: Doug Wilde (Page 1 of 9)

WCM Chart for July 22, 2022

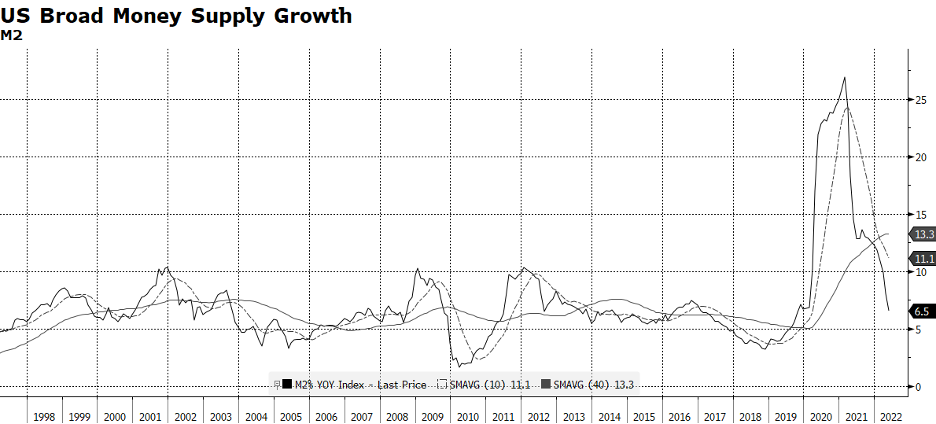
The growth in the US money supply is decelerating rapidly, which is problematic for the economy and capital markets. To be absolutely clear, the money supply itself is not shrinking – the rate of growth is. It is no secret that the US Federal Reserve is reining in liquidity by raising policy rates and decreasing the size of its $8.9 trillion balance sheet. Pre-pandemic, the Fed’s balance sheet was $4.2 trillion, less than half the current level. The reason why this is important is the Fed has largely been responsible for the explosive growth in the money supply over the past two years, which peaked at an annual pace of 26.9% in February 2021. To place that in context, the 30-year average annual growth rate of M2 is 6.4% while the current pace as of May 31st is 6.5%. But, examine the included chart. Barring the extraordinary, the current trace will crash right through the long term trend and keep going.

The 30-year average nominal US GDP growth is 4.6% according to the US Bureau of Economic Analysis. Over the long-term, M2 grows faster than nominal GDP in order to bolster economic activity, and when it slows, so does the economy. The level of M2 peaked at the end of March at $21,809 trillion, and has only grown 1.26% year-to-date. Given the receding liquidity in the US economy, it is no wonder why Q1 2022 was an anemic -1.6% (and revised down). What is critically important to us is that the Fed has been the most dominant force in money supply growth in this cycle. In more normal times, banks create money from their deposit bases, but this has been overwhelmed by the Fed’s quantitative easing programs. And so, navigating the path back to normal involves the Fed stepping back to its more traditional role.

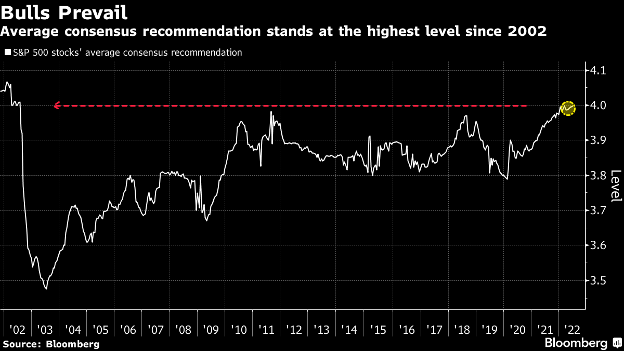
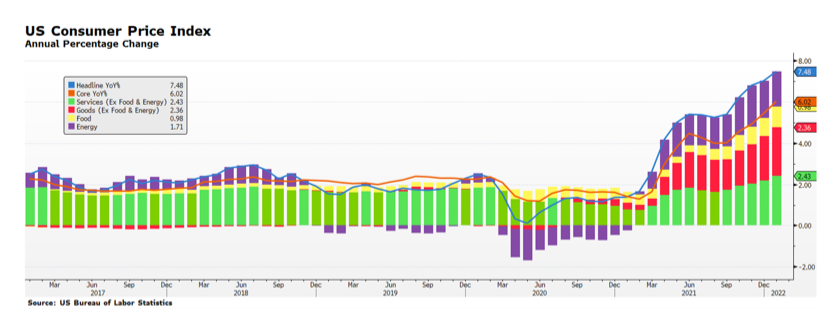
It is difficult to envision a scenario wherein the Fed engineers a “soft landing” while simultaneously reining in 40-year high levels of inflation and supporting economy and employment. GDP growth for the first half of 2022 will be reported on July 31st and we would not be surprised if another weak reading confirms that we are in a recession. Even so, the Fed has little choice but to maintain a less-than-dovish monetary stance given current inflationary trends here and abroad. [chart courtesy Bloomberg LP (c) 2022]

From the Board of Governors of the Federal Reserve System:

  1. M1 consists of (1) currency outside the U.S. Treasury, Federal Reserve Banks, and the vaults of depository institutions; (2) demand deposits at commercial banks (excluding those amounts held by depository institutions, the U.S. government, and foreign banks and official institutions) less cash items in the process of collection and Federal Reserve float; and (3) other liquid deposits, consisting of other checkable deposits (or OCDs, which comprise negotiable order of withdrawal, or NOW, and automatic transfer service, or ATS, accounts at depository institutions, share draft accounts at credit unions, and demand deposits at thrift institutions) and savings deposits (including money market deposit accounts). Seasonally adjusted M1 is constructed by summing currency, demand deposits, and other liquid deposits, each seasonally adjusted separately.
  2. M2 consists of M1 plus (1) small-denomination time deposits (time deposits in amounts of less than $100,000) less individual retirement account (IRA) and Keogh balances at depository institutions; and (2) balances in retail money market funds (MMFs) less IRA and Keogh balances at MMFs. Seasonally adjusted M2 is constructed by summing small-denomination time deposits and retail MMFs, each seasonally adjusted separately, and adding the result to seasonally adjusted M1.

WCM Chart for June 30, 2022

This chart comes to us from a Bloomberg article citing their proprietary US sell-side stock analyst ratings which have not been more bullish since 2002 (their scale is 1 to 5 with 1 being equivalent to a “sell” recommendation and 5 a “buy”). On the surface, they seem optimistic about equities, but we evaluate this data differently. From the end of June 2002, the S&P 500 fell (an additional) 21.1% until it ultimately bottomed at 776.76 on October 9, 2002. The index had previously fallen 33.3% from its peak on March 24, 2000 until June 30, 2002. There are several differences between 20 years ago and today. The S&P was even more top heavy with technology companies back then and there tended to be more gray hair among the analyst community than there is today. Throughout the past twenty years, our observation has been that company and industry analysts have tended to focus on micro issues and management guidance rather than macro forces that are actually dominating the path of equity markets. If the Es catch up with the Ps on the downside, which seems likely with rising rates and petroleum prices, a tight labor market and continuing supply chain issues, we will likely see chastened analysts quickly and belatedly revising down their ratings after the damage is done and the outlook for equities actually is improving.

WCM Chart of the Week for February 14, 2022

The February 10th inflation report for January was higher than expected. Key stock market gauges declined and were particularly weak toward the day’s close. Notably, all major inflation segments continue to rise — Services, Goods, and Food  — with the exception of Energy, but oil and gas prices are up so far in February.

The benchmark 10Y UST yield rose above 2.0%, which has been an adverse trigger level for stocks in the recent past. The real yield on US Treasuries is more than -5%, a historic anomaly. Meanwhile, the US Federal Reserve will begin reducing its balance sheet in March. It currently stands at $8.9T, increasing over $5T since the pre-pandemic low of $3.75T, about a 134% increase since the Fall of 2019.  Furthermore, the Fed is set to increase policy rates several times this year, perhaps as many as six times.

It is difficult to envision the Fed backing away from its intent to restrain monetary liquidity, especially considering that inflation trends appear to be gaining momentum. Consumer prices initially began to accelerate in March of last year, rising from 2% to about 4.5%, and had another upswing last Fall through the latest report. Headline inflation, now stands at 7.5%, a 40-year high level that very few, if any, at the Fed have had to deal with in a professional capacity.

Policy conditions are visibly changing, yet the equity market over the past couple of weeks attempted a rally from late January’s bottoms. The recent bid on US stocks could be value seekers, although the market is still fully valued if not overvalued considering a higher rate environment. It could be a response to more and more US states announcing a wind-down of COVID-era policies, or simply that capital needs a place to land and US stocks are more attractive than international equity markets or global bonds.

Absent a meaningful catalyst (we are still looking) we do not anticipate a sustained rally and expect the general trend of US equity prices to be range bound to downward. Investors must come to grips with a tighter monetary policy environment, higher interest rates and inflation. We note that other major central banks, notably the BOE, have increased policy rates, and the ECB is publicly debating the need to address inflationary trends on the European continent.  And, many emerging market CBs have already embarked on a tightening cycle. [chart data from US BLS © 2022]

WCM Chart of the Week for February 8, 2022

The market, in our view, is trying to come to grips with a less accommodative yet still supportive monetary and fiscal policy environment. Federal Reserve policy is dominant at this moment, since it appears fiscal policy progress has stalled until the mid-term elections and perhaps beyond. The Fed is unlikely to turn away from its recent pivot towards being less “dovish”, which in light of recent inflationary trends is still is a far cry from an aggressively “hawkish” stance.

It seems probable the market will re-test the lows of January 24th over the coming days or weeks, and from there we will ultimately see from which way the equity market breaks. The recent intra-day volatility was reminiscent of some of the price action during the financial crisis, particularly around the 2008 election. When it appeared that President Obama would easily win, the S&P 500 rallied over 18% from October 27th to election day November 4th. With deep uncertainty about who would fill the new President’s cabinet and what steps they would take to address the worsening crisis, the S&P 500 subsequently fell nearly 33%. The market ultimately bottomed when Timothy Geithner, Obama’s most important new cabinet appointee at that moment (Sec. Treas.), announced the deployment of the TARP funds. There are certainly differences between 2008-2009 and now, most notably the health of the financial sector. However, the market fears uncertainty and that is a common thread between now and then. Another more tenuous thread, but one worth watching, is the speculative bubble in digital assets that has already partially ruptured, and the run-up in residential real estate in part fueled by loose lending practices. Today’s uncertainty is primarily around what the future holds in a less accommodative monetary and fiscal environment. Economic activity, while still growing, appears to be slowing and high inflation persists, prompting concerns about the potential for stagflation. [chart: Wilde Capital Management © 2022, data from Standard & Poor’s 500 Index]

WCM Chart of the Week for January 18, 2022

Evidence of consumer price pressure abound ranging from rising food to energy to consumer staples. Overall, US consumer prices rose over 7%, a growth rate the US has not faced since the 1980s. There are several well-documented reasons why prices have risen so rapidly, including the pandemic-forced economic shutdowns and supply chain disruptions of the past two years. How long will inflationary conditions persist, and will it become structural? Prior to the pandemic, the US was in a benign inflationary environment. Then, disinflation resulting from government-mandated shutdowns across the country suppressed prices. The annual change in US CPI averaged 1.4% from April 2020 to April 2021. The current CPI reading on December 31, 2021 is based off pandemic nadir levels, and the base effect may lead to higher “headline” inflation in the months ahead. However, if annual gains in consumer prices fail to keep pace with the high inflation trends of 2021 [which include 2020’s low base effect], forward looking inflation could moderate. Capital markets will likely remain on edge, and the US Federal Reserve will be challenged balancing appropriate monetary policy against inflationary trends that may prove temporary, but also may not. (chart © 2022 Wilde Capital Management, data from Bureau of Labor Statistics)

WCM Charting the Way to 2022

Since March 2020 the US federal government has injected an enormous amount of stimulus into the economy. There have been seven stimulus and reliefpackages ranging from the original Coronavirus Preparedness and Response Supplemental Appropriations Act to The Families First Act to the CARES Act to The Consolidated Appropriations Act and the most recent American Rescue Plan. Even without Build Back Better, this fiscal expenditure legislation amounts to nearly $15 trillion over the life of the legislation with more on the way with the new infrastructure plan. The Federal Reserve has also injected a tremendous amount of liquidity in the system by expanding its balance sheet by $4.5 trillion since March 2020 while maintaining a benign interest rate and regulatory environment. The combined government stimulus over the past twenty months amounts to over 83% of current US GDP (as of end Q3 2021). Compared to the recessionary bottom in 2020, the same stimulus is nearly 100%. By contrast, the 2009 TARP expenditure amounted to about 5% of US GDP at the time. We do not have to look far to see from where upward pressure on asset prices and inflation comes.

WCM Chart of the Week for December 6, 2021

Through the end of November, the S&P 500 has delivered a robust 23.2% year-to-date total return, piling on to2020’s impressive full-year 18.4% clip. On its face, such strong stock market results would seem implausible given the disruptive forces of the pandemic, the multiple variants and building inflationary pressure here and abroad. The S&P 500 reached its pandemic bottom on March 23, 2020 and since then, the 20 month-end observations of rolling annual returns (shown on the chart) have averaged over 25.8%. To place that figure in context, the long-term average annual return since inception in 1987 is 12.38%. The low “base effect” climbing up from the pandemic bottom contributed to the relative strong % gains over the past twenty months, but there are also significant macro factors that have supported a booming US stock market that may prove to be headwinds going forward. [chart data courtesy Standard & Poors, Bloomberg LP © 2021]

WCM Chart of the Week for November 29, 2021

Consumer prices in the US are observably on the rise across a broad array of products and services. The Federal Reserve’s preferred inflation gauge, the PCE, last week registered a 4.1% annual increase, well above the Fed’s target. The causes of higher prices are well known, ranging from supply chain bottlenecks to raw material scarcity to higher energy costs to a shortage of transportation personnel. Adding to the inflationary mix is strength in the US dollar which has recovered over 6% according to the Bloomberg US Dollar index, comprised of a basket of major currencies. The dollar has recovered to pre-pandemic levels and could strengthen further as the Fed begins to reign in liquidity towards the end of 2022 if not earlier. Continued dollar strength could provide some inflationary relief in the form of lower import prices and could be justified given strong US economic growth and the interest rate differential between the US bonds and the rest of the world. As this week’s chart illustrates though, currency movements are notoriously difficult to predict. [chart courtesy Bloomberg LP © 2021]

WCM Chart of the Week for November 10, 2021

There were several positive aspects of last week’s BLS report on labor market conditions. Unemployment fell to 4.6% showing steady progress towards the multi-decade lows experienced prior to the pandemic. However, the overall labor market participation rate, at 61.6%, may be stagnating. Segmenting key age group participation rates (shown in this chart) unmasks a troubling trend — younger workers in the 18-24 year age bracket and prime aged workers in the 25-54 year old demographic are steadily returning to the workforce while older workers are not. Furthermore, participation in this older segment of the labor pool has receded to pandemic lows. There are several reasons for this, ranging from the natural consequence of an aging population to credible fears of viral and variant infections compounded by a booming stock market that has inflated retirement accounts potentially advancing planned retirement dates. Fewer people working, whether by choice or not, leads to lower tax receipts at a time when the US has persistent fiscal deficits. [chart courtesy of BLS, Bloomberg LP © 2021]

A WCM Seasonal Chart for October 15, 2021

The total return of the S&P 500 tends to be positive in the final quarter of the year, averaging nearly 5.2% since Q4 of 1989. The worst final quarters of the year occurred during the technology bubble, the financial crisis and most recently 2018. Let’s look at today’s headwinds. Inflation, which is near universal across the economy, works like a broad tax on everyone. Price increases in many segments of the economy are outpacing wage growth, and that is impacting consumption which makes up about 70% of GDP. Supply chain issues will likely persist into next year and perhaps beyond, continuing to pressure prices. Next, the Fed. Their actions or inactions will be scrutinized and probably criticized for years. Tapering will start soon, but liquidity and monetary support will still be positive, just less so. It is doubtful, even with so many Fed seats open, that President Biden will appoint hawks in this environment, so we expect that will keep the Fed accommodative for longer and rate hikes pushed out further. In the Fall of 2018, our last “bad” Q4, the Fed was in balance sheet reduction mode and in the midst of raising policy rates when Powell remarked that they were “not near interest rate neutrality” causing a rout in equities worldwide. Three years and a more seasoned Powell later means we do not expect the same rhetorical mistake will be repeated. We also need to watch the ECB. Inflation could be here for longer and that would fuel ongoing volatility. Bad for bonds but not necessarily stocks. For us, even with additional volatility, equities remain the default asset class at least over the next few quarters. [chart WCM © 2021, data from Bloomberg LP]

« Older posts