Author: Doug Wilde (Page 2 of 9)

WCM Chart of the Week for October 8, 2021

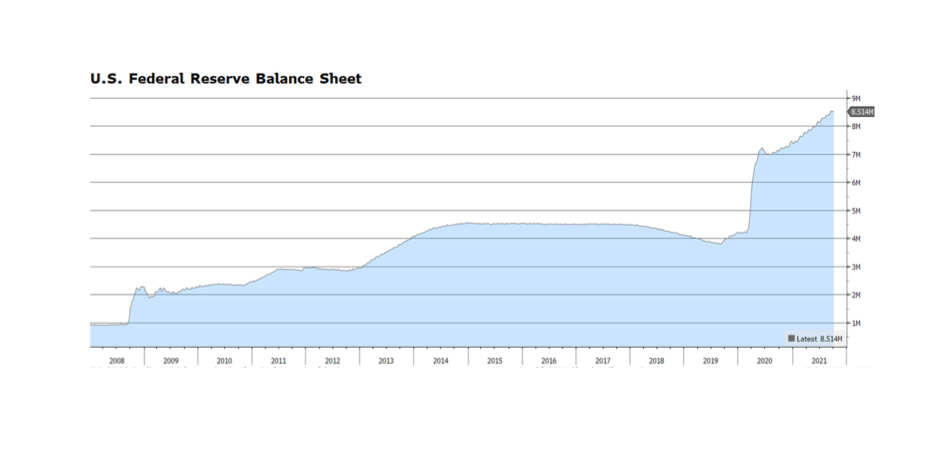
The US Federal Reserve balance sheet currently stands at $8.51 trillion, doubling in size since the pandemic began. The Fed has recently suggested that it may begin to taper the current $120 billion monthly purchases of Treasuries and mortgages as soon as the November 2nd-3rd meeting. Progress in employment is a potential trigger cited by Chairman Powell for tapering, even considering September’s lackluster jobs report. It is important to note that the Fed will likely continue to expand the balance sheet. What they are talking about is lowering the amounts of new monthly purchases over time, so expanding less fast. Still, a reduction in monetary liquidity. Of bigger concern are the inflationary trends that may force the Fed to introduce less accommodative or even restrictive monetary policy. Prices seem to be increasing nearly everywhere, from energy to food to wages, and the Fed’s preferred inflation gauge, the PCE Deflator, is up 4.3% year-over-year as of August. A combination of higher policy rates and lower liquidity would pose a serious challenge for capital markets. [chart courtesy Bloomberg LP © 2021]

WCM Chart of the Week for September 29, 2021

Natural gas prices around the globe are elevated, and as the colder winter months in the Northern Hemisphere approach, prices will likely remain so. An unfolding potential crisis is most acute in the Eurozone where natural gas futures prices have increased over 500% in the past year, and conditions in the rest of the world are not much better. Calmer weather in Europe and thus lower wind turbine energy production has been cited as one reason for elevated prices, and rising demand for natural gas as a lower-carbon transitional fuel away from coal and oil is another. Unchecked, the higher price environment may lead to blackouts, heating shortages in colder regions, and forced plant shutdowns, and may exacerbate current and broader inflationary trends. Also, higher utility prices are effectively a tax on consumers (hitting lower wage earners the hardest) hastening an end to the global economic recovery that may be already moderating or even stalling in some parts of the world.

WCM Chart of the Week for September 13, 2021

We are back, but maybe China is not. China’s purchasing manager index for exports has signaled a decline since April’s reading of 50.4 (a reading below 50 suggests a deterioration in conditions). This data series is interesting in the current inflation debate because it is a barometer of global trade and aggregate demand. If demand is weakening while headline consumer and industrial prices remain elevated, that suggests that the supply/demand balance is being dominated by supply-related issues. This could make sense given the numerous instances of supply chain bottlenecks, transportation issues, etc. that we have discussed and that continue to make headlines. Consequence for the markets — this may be another reason why the Fed may be dovish for longer. [chart courtesy Bloomberg LP (c) 2021]

WCM Chart of the Week — Summer-End 2021

This will be our last chart before Labor Day. The US Federal Reserve’s preferred measure of inflation, the YoY rate of change in the Personal Consumption Expenditure Index (PCE), has been exceeding its 2% target rate since April making investors concerned that we may be approaching a monetary tightening cycle. That fear was escalated by this week’s release of the Fed’s July 28-29th meeting minutes that indicated they may begin to wind down the current $120 billion monthly asset purchases by the end of this year or the beginning of 2022. The Fed has expressed its view that current inflation trends are transitory and are likely due to temporary factors such as supply chain bottlenecks and a strong rebound in demand from last year’s lull in consumption. As of June 30th, the current annual rate of the PCE was 3.54%, well above the Fed’s target, but in June 2020 the reading was 1.13%. Since the Fall of 2008 during the Financial Crisis, the PCE has been stubbornly below 2%, averaging 1.59%. Over that period of nearly 13 years, the PCE has been over 2% only in Q1 2012 and for most of 2018.  Inflation has been undershooting for a long period leaving aggregate price levels far below the Fed’s ideal. This suggests to us that the Fed will likely tolerate inflation until the PCE normalizes.

WCM Chart of the Week for August 9, 2021

Investment Grade and High Yield bond spreads have been edging higher since reaching their tightest levels ever at the end of last quarter. Admittedly, the spread widening may have more to do with the decline in Treasury yields since June 30th than an indication of any deterioration in the credit markets. What is interesting to us is that this has been occurring while broad stock market indices in the US and Europe are hitting all-time highs. Equity market valuations are full, particularly in the US, but according to Bloomberg consensus earnings are expected to grow by 11.8% over the next 12 months, putting the forward PE ratio of the S&P 500 at 20.3x, lofty yet not extreme. Our sense is that, barring a major surprise or a misstep by the US Fed, the positive tone in equities in the Western world will continue. The outcome of the Fed’s September meeting will be highly scrutinized but the likelihood that they will surprise markets is low. [chart courtesy Bloomberg LP © 2021]

WCM Bonus Chart for July 23, 2021

Because we took a hiatus for the holidays, we have extra thoughts to share. The US Bureau of Labor reported that consumer and producer prices came in higher than the consensus last week and that may have been part of the reason why stocks retreated. We view the consolidation in US stocks as healthy at this point, especially considering strong corporate earnings momentum and analysts increasing their earnings forecasts rather than the opposite, which oftentimes occurs at this point in the year. Forecasters usually have a difficult job but given the condition of the world during the pandemic and the incongruent economic recovery so far, it makes now even more challenging. Global bond markets are suggesting a different read on inflation and the near-term outlook for monetary policy, both benign for risk assets. The benchmark 10-year US Treasury bond yield continues its decent after the near-term peak of 1.74% on March 31st and now at 1.28%. Interestingly, government bond yields in the developed world have also fallen with equivalent US interest rates suggesting that current inflation readings are more of a temporary condition rather than a long-term concern. Disinflationary trends are starting to emerge including declining commodity prices, benign capacity utilization rates and strong productivity levels. If bond yields were trending higher along with stronger inflation readings we would be more concerned about risk assets. [chart courtesy Bloomberg LP © 2021]

WCM Chart of the Week for June 28, 2021

Since 2013, the NY Federal Reserve has been conducting a consumer survey focused on expectations for rental housing costs in the year ahead. The survey participants expect housing rental costs to soar a record 9.7% in the next 12 months, which is a major increase from the average of about 5.6% since the survey began nearly eight years ago. Survey data and other “soft” indicators, while useful, tend to lag hard data. Granted, there are also widespread reports of labor shortages and lack of transportation, but that is most likely a temporary condition. Taking this and other signals into account, we would be more concerned about inflation becoming a more permanent problem if the bond market was behaving as if the economy was moving towards that. But, the benchmark 10-year US Treasury bond yield, now standing at 1.47%, has descended from its peak of 1.74% on March 31st. Also, some key commodity prices are declining — the lumber crack spread (cited by WCM on June 14th) has fallen over 30% in two weeks. For now, we view these pockets of inflation as more of an adjustment from pandemic-created economic readings rather than a permanent progression towards higher consumer price levels. [chart courtesy NY Fed and Bloomberg LP © 2021]

WCM Chart of the Week for June 22, 2021

Those participating in the frenzy in crypto-related investing may be in for some more downside pain in the months ahead as a bellwether, Bitcoin, has formed the notorious “death cross”, which is when the 50-day moving average falls below the 200-day. So far it is approaching nearly a 50% drop since its peak in mid-April. Technical analysis may be more useful in evaluating the merit of such investments that have no or little fundamental data on which to base a decision. Part of the rationale for investors to acquire positions in Bitcoin and other related investments lies in the idea of using them as a means of exchange and potentially as a store of value. The latter dimension has been gaining credibility as major central banks continue to pursue aggressive quantitative easing, effectively debasing their currencies to one degree or another. We cannot divine where the trend in cryto investing is headed in the intermediate term, but there is no denying that interest is growing. If recent history is any guide, investors who chose to hold these investments need to be prepared for further losses. The previous two times when death crosses were formed in 2018 and late 2019, losses surpassed 64% and 30%. Not for the faint of heart. [chart courtesy Bloomberg LP (c) 2021]

WCM Chart of the Week for June 14, 2021

Consumers of lumber products may finally see an end to soaring prices. Lumber crack spreads (the difference in prices of finished lumber and raw timber) have been rapidly falling since peaking in early May. Specifically, the measure on this week’s chart uses the CME futures spot rate of random length softwood 2x4s used in construction minus the Timber Mart-South US Louisiana Pine Sawtimber spot rate. Both indices are falling with finished board prices falling at a faster pace.

There are a variety of reasons why finished lumber prices surged, ranging from a beetle infestation in western Canada and the US Pacific Northwest, strong pandemic-stimulated single family housing demand, glue shortages related to the storm-induced petrochemical plant shutdowns in Texas earlier in the year, and a lack of truckers and workers for sawmills. This confluence of events may be playing out in other industries and be part of why the Fed considers rising key consumer and producer prices transitory and not permanent. Nonetheless, inflationary concerns that recently unnerved the capital markets will likely continue to arise for some time to come. [chart courtesy Bloomberg LP © 2021]

WCM Chart of the Week for June 1, 2021

On Monday, China’s Politburo, the CCP’s top decision-making body, announced that all married couples could have up to three children along with expanded government support for child rearing and education. It is widely speculated that this is driven by deteriorating demographics in China. In this week’s chart we observe the continued and accelerating upward trend in the 65+ age group versus China’s total population. The Wall Street Journal reported that the prime working age population (citizens between the ages of 15 and 59) has declined from 70.1% in 2010 to 63.35% in 2020. Age distribution is critical to economic vitality and notoriously difficult to alter and in China, the one child policy that was lifted in 2016 may have created a new norm because it lasted so long. The effect may be a permanently lowered replacement rate. We can’t help but find it ironic that the directive comes from the Politburo which is dominated by 60+ year old men (we could only find one female on its current roster). Another significant point that Peter Orszag, a widely respected former Washington budget official, notes in his Bloomberg opinion piece of May 11th, a declining Chinese population could mean lower carbon emissions, which is material since China’s total carbon footprint exceeds that of the entire OECD combined (27% of global GhGs). [chart courtesy Bloomberg LP © 2021]

« Older posts Newer posts »