Author: Doug Wilde (Page 3 of 9)

WCM Chart of the Week for May 25, 2021

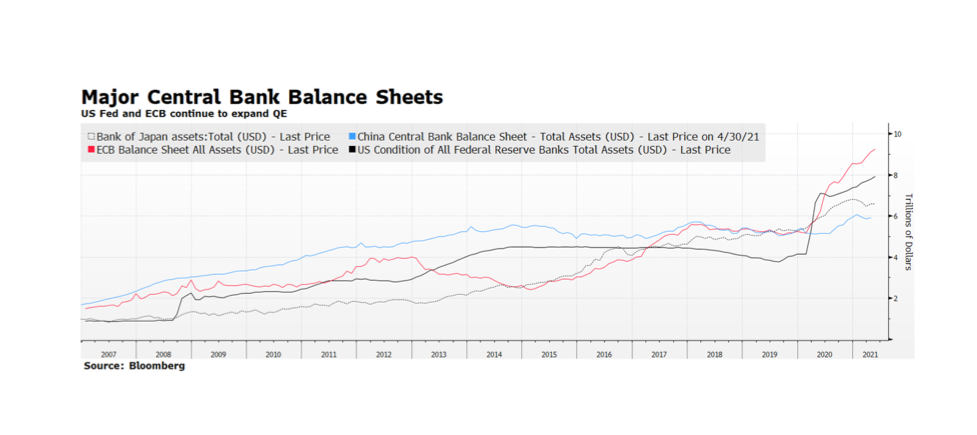
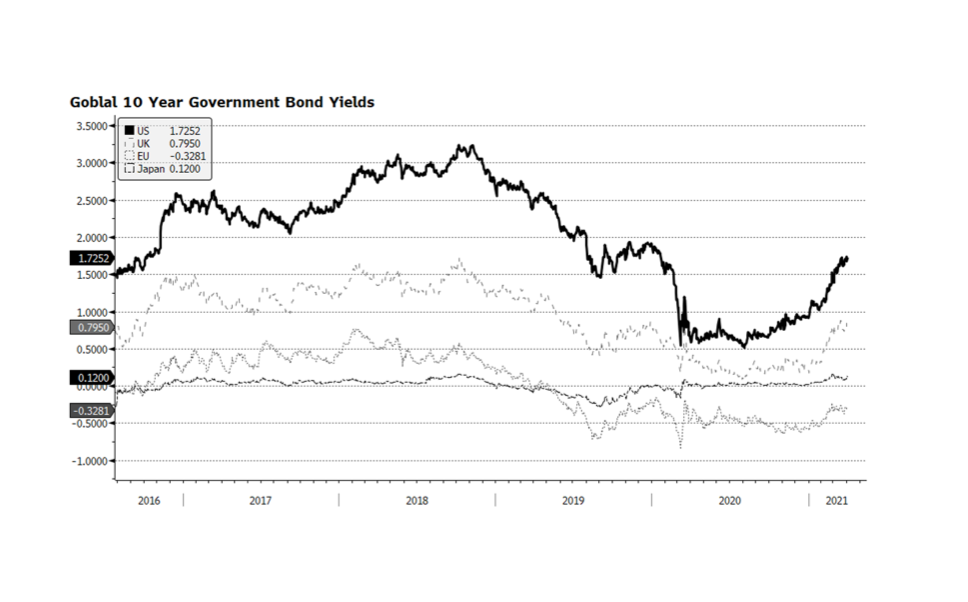
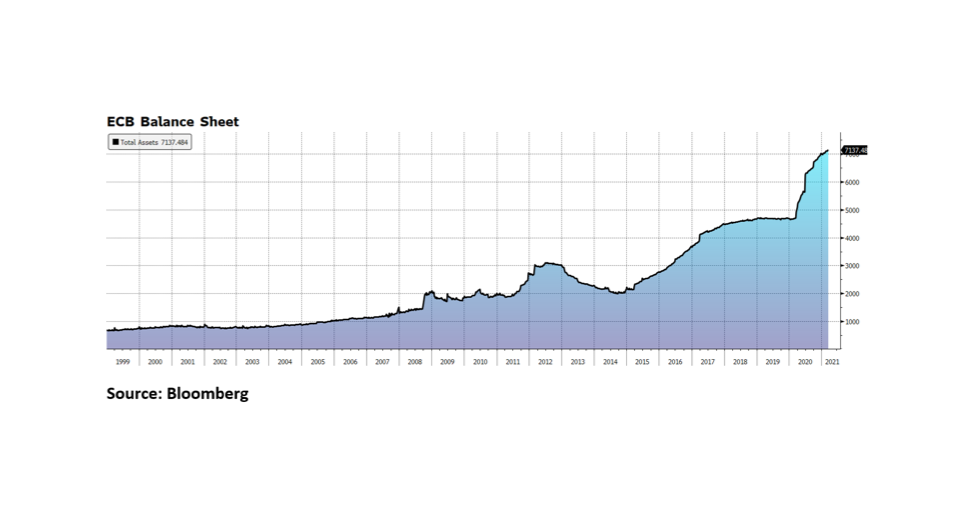
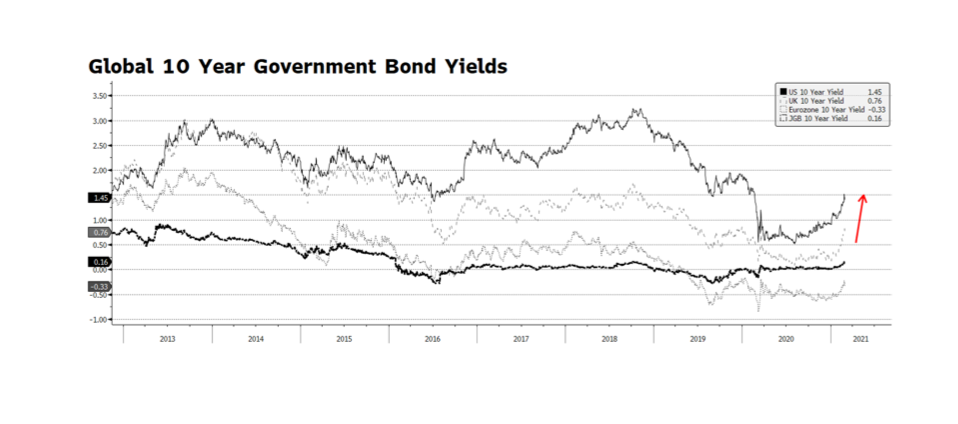
The US Fed and European Central Bank (ECB) continue to pursue aggressive quantitative easing while the two dominant Asian central banks, the Bank of Japan and the People’s Bank of China, have slowed their securities purchases so far this year. The ECB’s activity is of particular interest, not only because of the size of the balance sheet ($9.2T, €7.6T), but the pace that it has expanded over the course of the past year. The ECB’s monetary support continues at a critical time as the EU economy appears to be emerging from the pandemic-induced slump. Lock downs are slowly being lifted and infection rates are plunging from the March and April spikes. Another promising (gradual) trend emerging is in sovereign interest rates in the region, which appears to be an indication of stronger economic activity in the months ahead. [chart courtesy Bloomberg LP (c) 2021]

WCM Chart of the Week for May 17, 2021

According to the US Federal Reserve, growth in the money supply, widely described as M2, peaked at nearly 27% at February’s month end reading and as of March it registered a 24% annual clip. To place those figures in context, the pre-pandemic average annual growth rate of M2 over the preceding 20 years [February 2000 – February 2020] was 6.1% according to Fed data. The previous peaks in M2 growth never surpassed 10.3%. Put another way, the entire US money supply, from the birth of our nation to now, expanded by around 25% in the past year alone.

This tremendous amount of additional liquidity is tied to quantitative easing and the numerous fiscal stimulus plans that have delivered direct payments to individuals and families that, for the most part, landed in bank deposit accounts. Commercial Bank Liabilities, the equivalent of consumer deposits, have swelled some 26% since the beginning of the pandemic, indicating that stimulus recipients have fortified savings as opposed to increasing spending. The good news is that consumers are in better shape than they have been in several years. The bad news, if it can be considered that way, is that there is likely pent-up demand that could ultimately fuel inflationary concerns.

The most recent annual headline inflation figure (CPI) reported by the US Bureau of Labor Statistics for April was 4.2%, well above the consensus of 3.6% and over two times the Fed’s target rate. Our main concern is whether the recent upward trend in prices is reflationary or a more enduring inflationary trend. The Fed has stated that it considers current price conditions to be “transitory” and thus falling into the reflationary category. [chart courtesy Bloomberg LP © 2021]

WCM Chart of the Week for May 11, 2021

The US Census Bureau’s latest survey of retail sales will be reported on May 14th. The Bloomberg survey of economists’ average forecast is for a 1.0% monthly gain, adding to March’s torrid 27.9% annual pace. March’s level of over $614 billion in purchases is nearly 17% higher than the pre-pandemic level of $525.8 billion of February 2020. Consumption, the most dominant portion of the US economy, is clearly rebounding and could further stoke inflationary concerns. This is occurring as hundreds of billions of US fiscal stimulus dollars have yet to be fully deployed with potentially more on the way on top of elevated commodity prices, shortages in building materials and the labor force far from full employment levels. The Fed remains committed to QE, in effect managing the entire yield curve, and has publicly stated that it will tolerate higher inflation. But for how long? Market pressures may force the Fed to act sooner than they currently plan and that could be a major shock to the system. [chart courtesy Bloomberg LP © 2021]

WCM Chart of the Week for April 26, 2021

Bloomberg’s most recent update on economists’ expectations for the US Federal Reserve to begin tapering its asset purchases found that 45% of those surveyed believe the Fed balance sheet will begin to contract in Q4 of 2021. This is important because expectations are moving forward, as the previous month survey (March) had only 27% of respondents foreseeing the Fed tapering beginning in Q4 2021. The main difference between the April and March reports was a shift from Q1 2022 to Q4 2021. The Fed is not expected to alter policy in this week’s FOMC policy statement release and will likely maintain highly accommodative monetary conditions. But, the shift in expectations may turn out to be critical for capital markets. Benign Fed policy has been one of the main factors supporting asset prices over decades and especially in recent years. The shift in expectations may become a headwind for risk assets in the months ahead.

WCM Chart of the Week for April 12, 2021

According to Citigroup’s Earnings Revision Indices, Eurozone earnings are far outpacing the rest of the world, and equity prices are gaining on a relative basis as well. Year-to-date through April 12th, Eurozone shares still trail the S&P 500 total return in US dollar terms 7.2% to 10.2%. Equity investors may be signaling that even in the midst of reimplemented economic shutdowns and virus spikes, the worst may be over on the Continent and more prosperous conditions are on the horizon. There are also reasons to be optimistic about the region’s stocks — they trade at favorable valuations compared to US equities and the ECB is continuing to be highly accommodative making fixed income alternatives unattractive. If Eurozone equities can continue to rally and broaden the global advance of stocks it would likely provide a boost of confidence for investors worldwide. [chart courtesy Bloomberg LP, Citigroup © 2021]

WCM Chart of the Week for April 5, 2021

Not surprisingly. as the global economy recovers, benchmark bonds yields in the developed world are on the rise. The spreads between US rates and the developed world are also widening, particularly versus the EU and Japan. We are concerned that higher yields in the US will pull interest rates higher in the Eurozone, which is already not recovering from the pandemic as quickly as much of the rest of the developed world, complicated by their slower pace of vaccine deployment. Another major concern is the cost of US debt servicing in a higher yield environment as the US Federal government embarks on yet more fiscal spending legislation that, if passed, will push the government debt-to-GDP ratio to levels that have plagued Japan for decades. [chart courtesy Bloomberg LP © 2021]

WCM Chart of the Week for March 29, 2021

It has been just over a year since stocks around the world began to recover from the pandemic-driven sell off. Stocks in the US found their bottom around March 23, 2020.  Since then, returns have been unusually strong with small cap stocks leading the way with the Russell 2000 Index up 115% and the Nasdaq Composite up nearly 90%. The rebound is not so surprising given the amount of fiscal and monetary stimulus that has been injected into the economy over the past year. The fiscal stimulus including the CARES Act, PPP, Consolidated Appropriations and the American Rescue Plan amount to over $5.4 trillion, while the Federal Reserve has expanded its balance sheet by nearly $3.6 trillion. Taken together, the stimulus efforts amount to over 43% of 2020 US GDP with even more potential fiscal plans. To place the astronomical stimulus in context, the Bureau of Economic Analysis (BEA) announced on March 25th that US GDP contracted 3.5% in the full year 2020. The BEA also announced its Q4 2020 GDP estimate indicating expansion at a 4.3% pace following Q3 growth of 33.4%. With the economy clearly on a strong path to recovery, we see continued stimulus as potentially overkill, at least in market terms, and the excess liquidity will likely produce further gains in stocks in the months ahead. [chart courtesy Bloomberg LP © 2021]

WCM Chart of the Week for March 22, 2021

The European Central Bank’s net purchase of bonds through March 19th surpassed 21 billion Euros, the most since December, in an attempt to halt the rise in continental bond yields. According to Bloomberg, the yield on the Generic 10-year Euro Government Bond has risen from -0.67% in mid-December last year to -0.3% currently. Granted, Euro yields from 2-to-10 year issues are still negative but the pace of escalation has many concerned given the economic headwinds caused by the pandemic and the recent resurgence of infections and “re”closings. ECB President Christine Lagarde arguably faces a tougher challenge than her central bank counterparts because the EU does not have the fiscal flexibility of other major economies. That constraint may turn out to be a blessing for them as the US, for instance, implements yet another round of fiscal stimulus amounting to $1.9 trillion while the economy across the pond shows signs of accelerated economic activity.

WCM Chart of the Week for March 8, 2021

According to the widely followed Shanghai Shenzhen CSI 300 Index, Chinese equities have abruptly fallen into correction territory, declining over 12% from their near-term peak on February 10th. The consensus is the correction was overdue given extended valuations of the dominant companies in the index. Historically, Chinese share prices have been volatile but tolerant investors have been rewarded with strong relative returns. However, this rout is concerning because market participation within China has been declining since late Summer 2020. Chinese equities did help lift share prices across Asia, broadening the global stock market rally beyond just US technology companies. But, we are now seeing some of the flipside of this correlation as price action in Chinese stocks is adversely impacting broader Emerging Market equities which have been among the world’s top performing assets so far this year. [chart courtesy Bloomberg LP © 2021]

WCM Chart of the Week for March 1, 2021

Equity markets around the globe were on edge as February came to a close. The technology-laden NASDAQ fell nearly 7% from an all-time high on February 12th. The weakness in equity prices came despite very accommodative comments from US Federal Reserve Chairman Jerome Powell during his scheduled two-day Congressional testimony last week. Equity markets became unnerved as government bond yields began to rise at an accelerated pace in the US, Eurozone and particularly the UK. Benchmark interest rates have been rising since the beginning of this year and US interest rates have been climbing since last Summer signaling expectations of improving economic conditions in the months ahead. As long as the rate environment increases gradually, gains can continue in equity markets. But, as we witnessed over the past few weeks, a steep ascent in market interest rates will have an expected adverse impact on risk assets. [chart courtesy Bloomberg LP (c) 2021]

« Older posts Newer posts »