According to the US Federal Reserve, growth in the money supply, widely described as M2, peaked at nearly 27% at February’s month end reading and as of March it registered a 24% annual clip. To place those figures in context, the pre-pandemic average annual growth rate of M2 over the preceding 20 years [February 2000 – February 2020] was 6.1% according to Fed data. The previous peaks in M2 growth never surpassed 10.3%. Put another way, the entire US money supply, from the birth of our nation to now, expanded by around 25% in the past year alone.
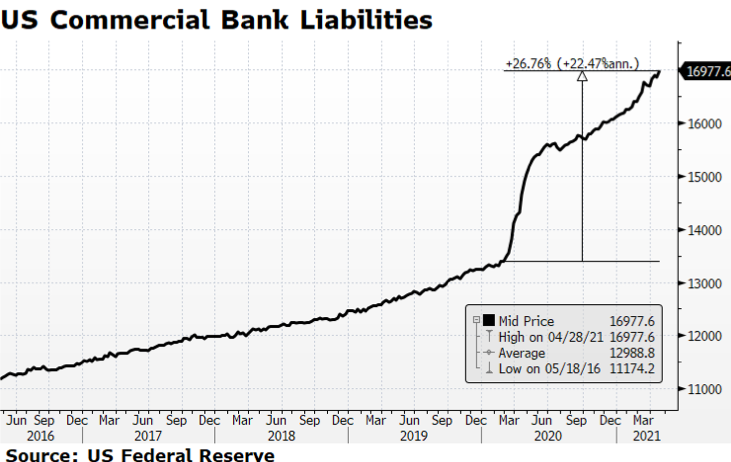
This tremendous amount of additional liquidity is tied to quantitative easing and the numerous fiscal stimulus plans that have delivered direct payments to individuals and families that, for the most part, landed in bank deposit accounts. Commercial Bank Liabilities, the equivalent of consumer deposits, have swelled some 26% since the beginning of the pandemic, indicating that stimulus recipients have fortified savings as opposed to increasing spending. The good news is that consumers are in better shape than they have been in several years. The bad news, if it can be considered that way, is that there is likely pent-up demand that could ultimately fuel inflationary concerns.
The most recent annual headline inflation figure (CPI) reported by the US Bureau of Labor Statistics for April was 4.2%, well above the consensus of 3.6% and over two times the Fed’s target rate. Our main concern is whether the recent upward trend in prices is reflationary or a more enduring inflationary trend. The Fed has stated that it considers current price conditions to be “transitory” and thus falling into the reflationary category. [chart courtesy Bloomberg LP © 2021]