Author: Doug Wilde (Page 4 of 9)

WCM Chart of the Week for February 22, 2021

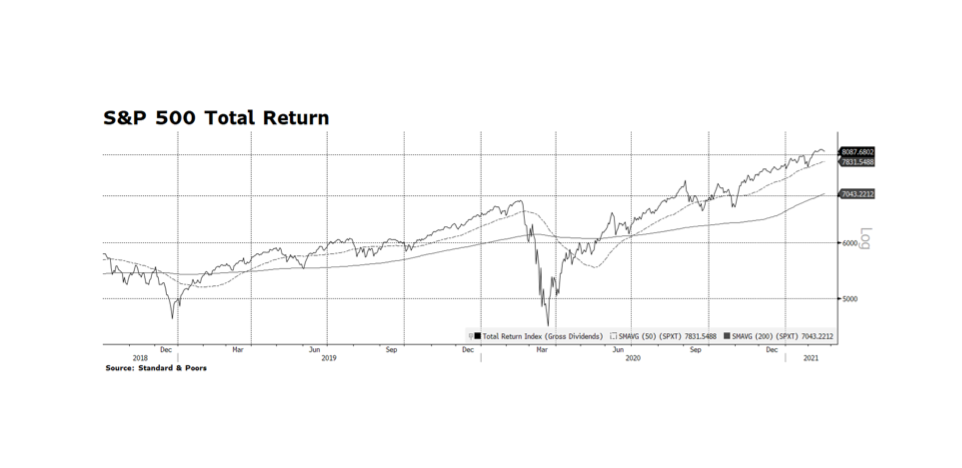
As we pass through the 12-month mark of the pandemic-caused rout in equities and risk assets across the world, investors are concerned about stretched stock market valuations, tight investment grade and high yield credit spreads, rising interest rates and poor labor market conditions. As of February 22nd, the one-year total return on the S&P 500 is just over 18% which is significant by any historical measure. As the next month or so passes, and as long as equity prices stay near where they are now, trailing returns are likely to grow even stronger as the anniversary of the March 23rd market bottom approaches. This may provide an additional psychological boost for investors as more stimulus is poured into the economy. Our concern is that the tremendous forthcoming stimulus now being debated in Congress might not be fully needed, or at least might not be properly apportioned. The stimulus may propel stocks higher here and abroad but may force the US Fed, which remains the dominant force in global capital markets, to reign in liquidity sooner than the market anticipates. [chart courtesy Standard & Poors and Bloomberg LP ©2021]
WCM Chart of the Week for February 15, 2021

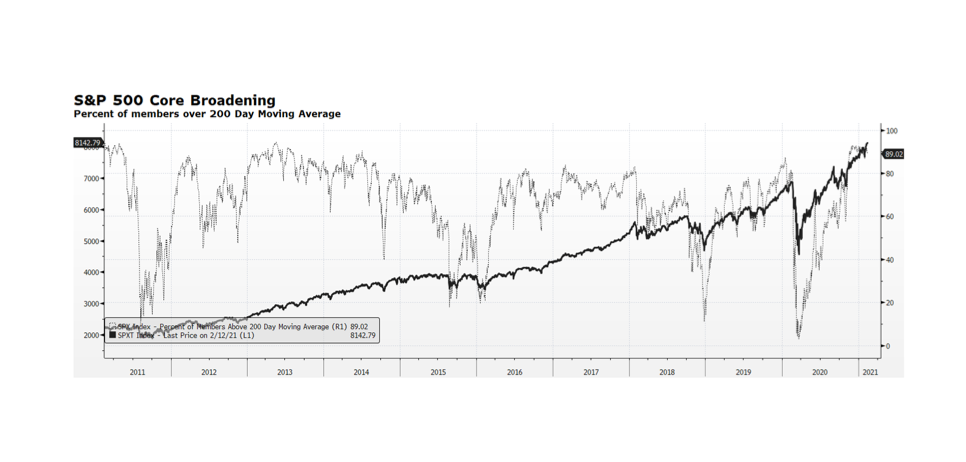
Investors are concerned that US equity market levels are reaching new all-time highs and valuation readings continue to be stretched. Several months ago narrow leadership within US stocks was the reason to justify underexposure to the asset class. Market participation has broadened considerably since the pandemic-caused nadir of 2020 as equity prices have climbed. One measure of greater market participation is the percentage of stocks trading above their long-term trends, depicted as the dotted line in the chart, revealing 89% of the S&P 500 universe trading above their 200-day moving average. While the current level of participation is high, it can persist for prolonged periods as it had over the past decade. The 2010s were a period of slow economic and job growth post-financial crisis, and yet equity prices delivered robust gains during times of high participation, only temporarily interrupted by bouts of Euro-related uncertainty, the US Treasury debt downgrade, and the “Taper Tantrum”. Given the amount of monetary and fiscal support pledged by the Fed and Congress, our sense is that US stock prices could maintain their general upward trend even in the face of more near-term challenges. [chart courtesy Bloomberg LP, © 2021]

WCM Chart of the Week for February 2, 2021

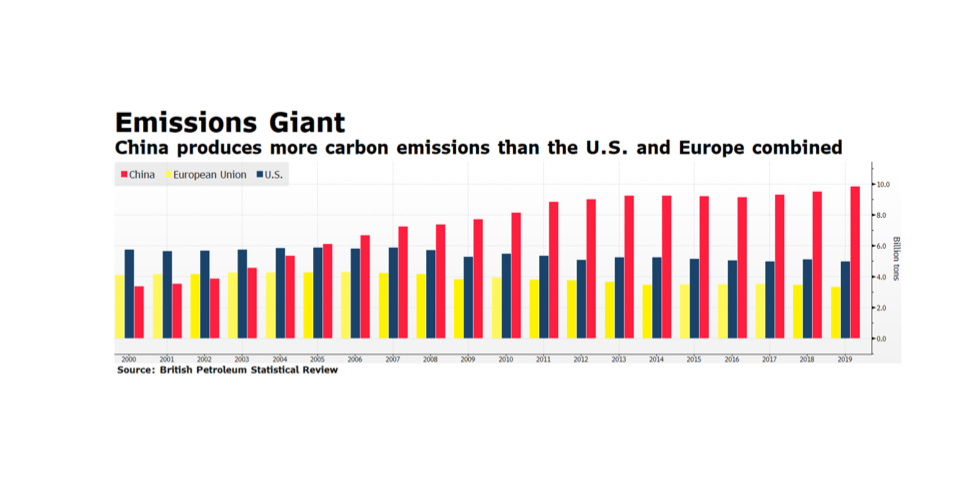
It is not surprising that China’s carbon emissions are growing given relatively strong economic activity compared to the developed world. Or perhaps it is given China’s pledge of carbon neutrality by the year 2060. China’s contribution to carbon in our atmosphere is approaching 10 billion tons annually, an amount that is greater than the US and Europe combined. To place that in context, according to the World Bank, as of 2019 the Chinese economy is only 38.6% of US and EU economic output. It is important to note that carbon output in the US and Europe has been steady and even declining as their economies are expanding. Another startling fact is the Chinese economy represents 16.3% of Global GDP (also World Bank data) and yet contributes nearly 29% of the 34.2 billion tons of carbon emissions, according to the British Petroleum Statistical Review. In our view, China has a great deal to do to meet its 2060 carbon neutrality pledge on its way to becoming the world’s largest economy, starting with action on its COP21 Paris commitments including reducing its dependence on coal.  [chart courtesy British Petroleum Statistical Review, © 2021]

WCM Chart of the Week for January 25, 2021

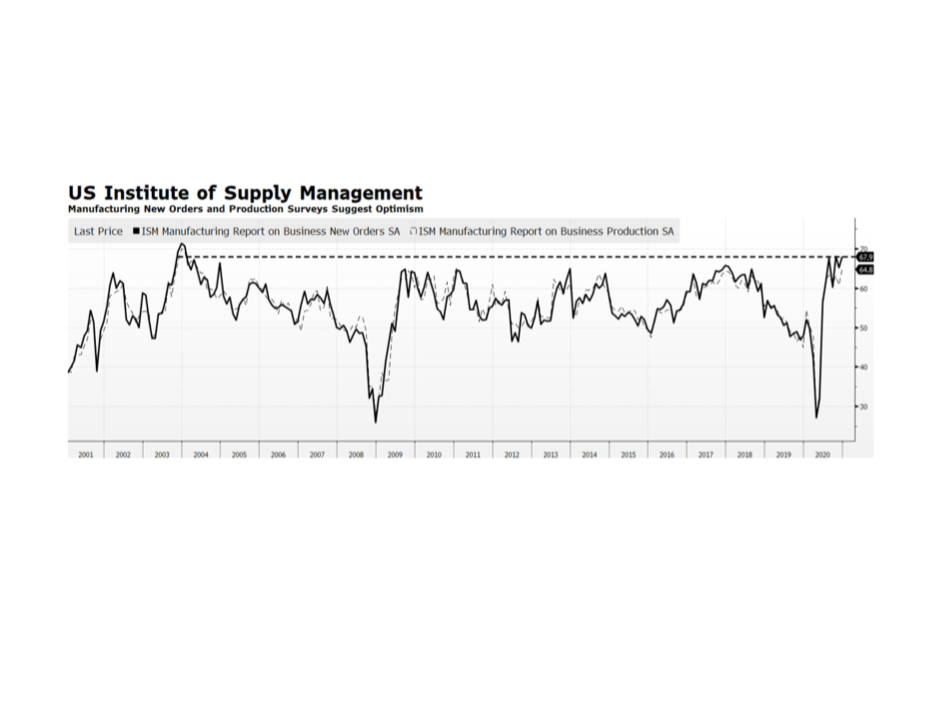
While conditions in the US labor market remain dire with initial and continuing jobless claim registering persistently high levels, other surveys are showing early reasons for optimism. The US ISM (Institute of Supply Management) produces several influential surveys of their members, and they have released key reports on the impact of COVID-19 on US business trends. The December surveys on US Manufacturing New Orders and Business Production suggest that purchasing managers are optimistic. In fact, the New Orders reading stands at a level not seen since 2004. This is a critical development because, if business optimism remains elevated, eventually staffing will have to expand bringing job seekers back to work. A lot needs to occur for the economy to fully recover — vaccines need to be distributed in mass and be effective, people need to feel comfortable re-engaging in economic activity, and states need to allow businesses and schools to reopen. We believe supply managers are seeing beyond these significant near-term challenges to an economic recovery in the quarters ahead. [chart courtesy US ISM, Bloomberg LP © 2021]

WCM Chart of the Week for January 18, 2021

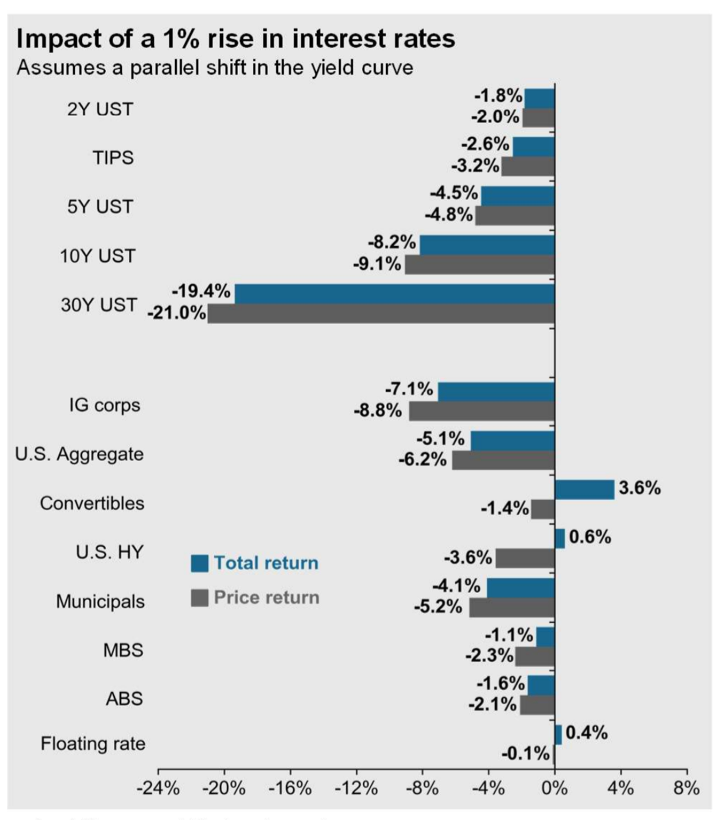
This week’s chart comes courtesy of J.P. Morgan Asset Management’s “Guide to the Markets” quarterly publication, expressing the near uniform adverse bond market impact of a nominal 1% rise across the yield curve. A key assumption cited in the chart subtitle is that the shift in the curve is parallel, which rarely happens. Yet, the illustration highlights a major challenge for US bond investors in the months ahead.  There may simply be few segments within fixed income where investors can expect positive total return. It is reasonable to assume that the rise in intermediate-to-long term US Treasury rates will continue, eventually approaching pre-pandemic levels. The yield on the 10-year US Treasury has risen from 0.5% on August 4, 2020 to 1.08% on January 18, 2021, while it stood at 1.77% 12 months ago. According to JPM’s analysis, only US Convertibles, High Yield and Floating Rate securities can be expected to deliver modestly positive total return in the year ahead. There are other key assumptions that would change the results of their modelling, such as benign equity market conditions and a steepening yield curve, but the chart illuminates the harsh reality facing bond investors in 2021. [chart courtesy JP Morgan Asset Management © 2021]

WCM Chart of the Week for December 21, 2020

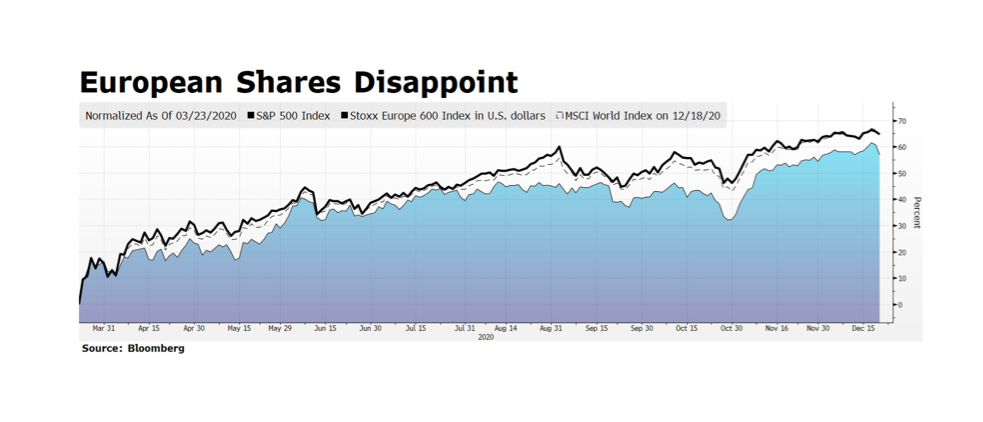
European equities have been rallying yet continue to lag the US and the rest of the world. Since global equities found their pandemic-induced bottom on March 23rd, both the S&P 500 and the MSCI World Indices have rallied over 65% as of last week’s closing levels (12/18/2020) while European shares have climbed just over 60% measured in US dollar terms. While a 60% recovery in approximately three quarters is impressive, it is masked due to currency movement over the period. The Eurostoxx 600 itself has climbed 44% in local currency terms from March 23rd through Friday’s close, and the Euro has rallied over 17% since March 23rd. The disparity in performance suggests a few things to us. First, European investors may have less confidence in their stock markets due to a lack of forceful coordinated continental response to the pandemic. Second, the currency tailwinds for European shares reflect more of a “retreat” from the pandemic flight-to-safe-haven currencies like the Dollar than true economic resiliency. Finally, we are particularly mindful that other stock markets beyond Europe may offer superior growth prospects, which would be especially attractive in a low-growth developed West.

WCM Chart of the Week for December 14, 2020

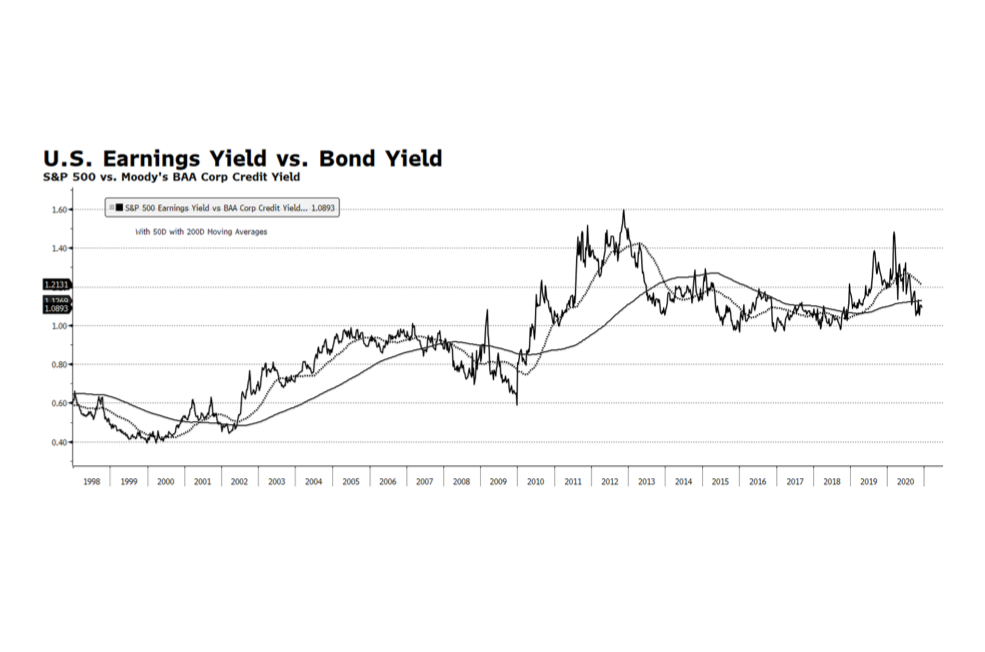
US stock market indices are trading near all-time highs and many market observers are highlighting valuation measures that are reaching levels last seen during the dot-com era. The bellwether S&P 500 is currently approaching a forward price to earnings ratio of 26 times consensus earnings while other key metrics such as price-to-cash flow and price-to-book are also well above their long-term trends. This is a cause of concern but not necessarily alarm even as valuations stand at premiums compared to the rest of the developed world. The Fed model which compares the S&P earnings yield to the yield on BAA US Corporate Credit is registering readings near its long-term average after reaching extremely attractive levels at the onset of the pandemic. A major tailwind for US equities is likely to be a continued benign interest rate environment heading into 2021 and perhaps beyond. The US Federal Reserve has signaled accommodative policy conditions perhaps reaching well into 2022 and fiscal policy remains supportive as well. Both policy positions should be supportive of US stocks in the intermediate term. [chart courtesy Bloomberg LP © 2020]

WCM Chart of the Week for November 30, 2020

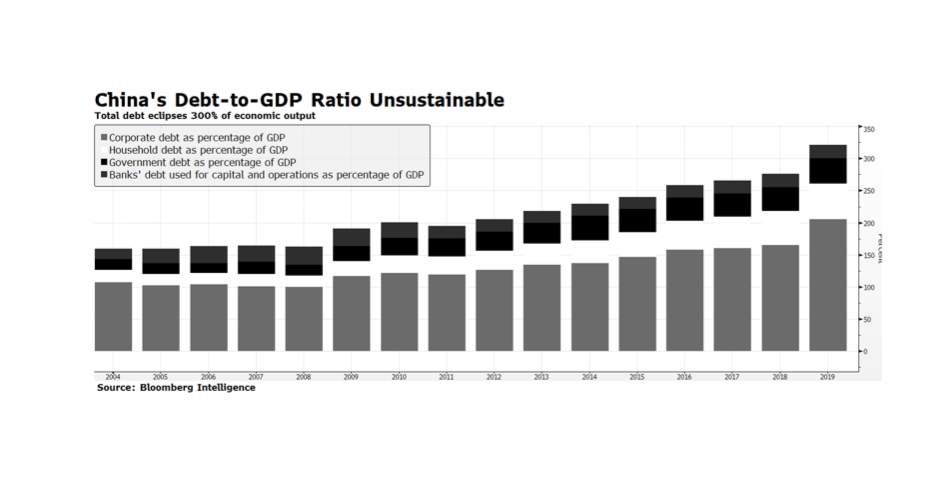
Beyond the rosy headlines of a strong economic recovery and a rally of over 40% in the Shanghai Shenzhen CSI 300 Index from the depths of the pandemic, trouble may be brewing in China’s bond markets. Total debt in China was approaching 325% of GDP in 2019, a point that economies generally struggle. The largest segment of total debt growth from 2018 to 2019 was in the corporate sector, which rose from 165% to 205% of GDP. China’s 2019 corporate debt binge appears to have hit a wall. According to Chinese media reports as much as 69% of private enterprises have defaulted on their outstanding loans so far in 2020 and the festering crisis may impact local governments and state enterprises as well. Further deterioration in the Chinese financial system would obviously have negative implications for the rest of the world.

WCM Chart of the Week for November 23, 2020

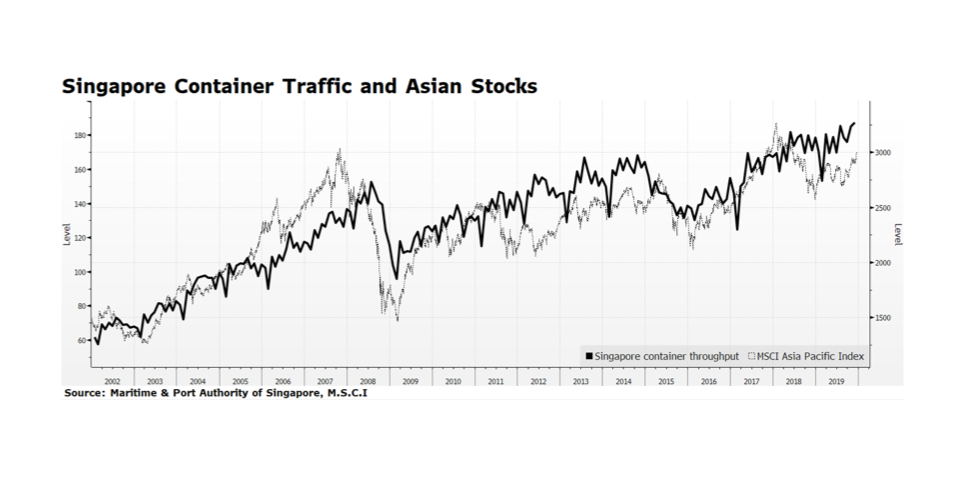
Trade flow in Asia is maintaining momentum after rebounding from the pandemic-caused low in February. Container traffic in Singapore has recently reached an all-time high level which many see as a proxy for trade in the region (or even the world) given its unique geographical location and distribution capacity. Improving economic trends in the region are also reflected in stock prices.  The MSCI Asia Pacific Index, which includes both developed and emerging equity markets, is leading global equities. The total return of the index is up 13.4% compared to the 9.5% return for FTSE All Cap Global Index so far this year through November 20, 2020. We view this as potentially a good omen for global equities because it may signal that the equity rally is broadening beyond the US. [data courtesy Maritime & Port Authority of Singapore, MSCI; chart courtesy Bloomberg LP © 2020]

WCM Chart of the Week for November 16, 2020

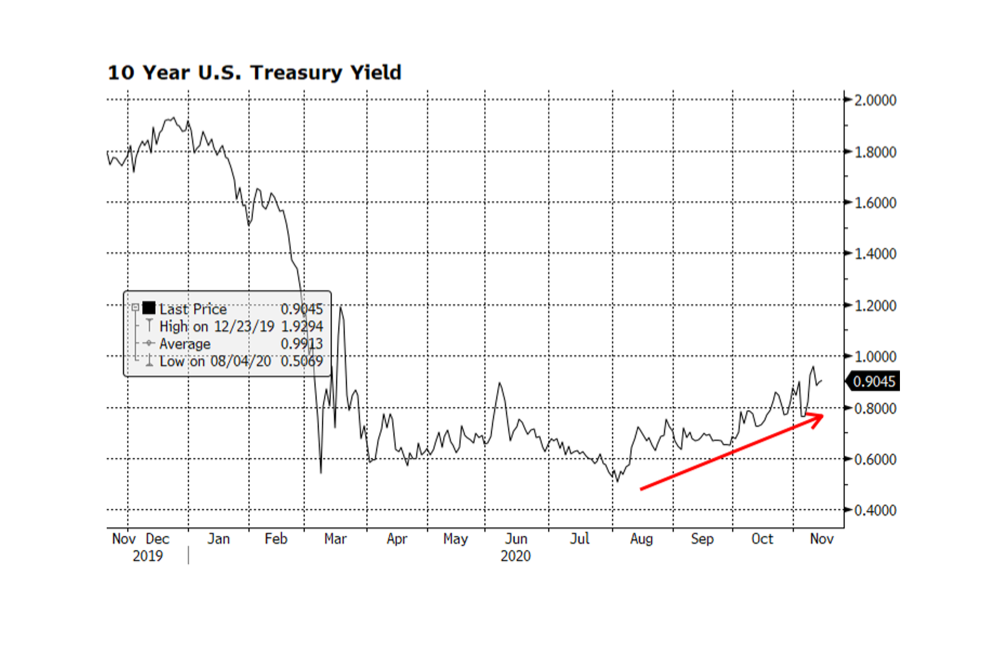
With US stock market indices across the capitalization spectrum at or above all-time highs, US Treasury yields have been grinding higher. Since early August, the yield on the benchmark 10-year Treasury has risen from an all-time low of 0.51% to 0.9%, forcing long-term US Treasury prices down over 7% since then according to the Bloomberg Barclays Long Term US Treasury Price Index. US stock prices have been rallying due to the announcements of highly effective COVID-19 vaccine trials, building economic momentum, clarity developing in the US political landscape and resilient as well as improving corporate fundamentals. We expect US interest rates will continue to normalize to pre-pandemic levels in coming quarters and that will likely keep downward price pressure on long term Treasuries. We expect this to be gradual given that comparable sovereign rates in Europe and Asia remain much lower or even negative. Overall conditions should be supportive for equities heading into 2021 even in the face of higher US Treasury yields. [chart courtesy Bloomberg LP © 2020]

« Older posts Newer posts »