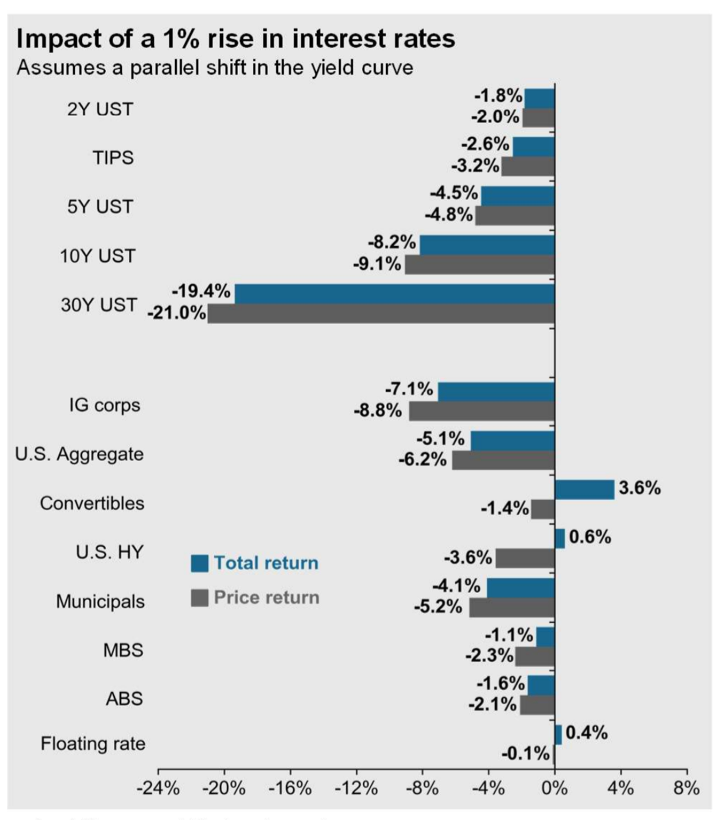
This week’s chart comes courtesy of J.P. Morgan Asset Management’s “Guide to the Markets” quarterly publication, expressing the near uniform adverse bond market impact of a nominal 1% rise across the yield curve. A key assumption cited in the chart subtitle is that the shift in the curve is parallel, which rarely happens. Yet, the illustration highlights a major challenge for US bond investors in the months ahead. There may simply be few segments within fixed income where investors can expect positive total return. It is reasonable to assume that the rise in intermediate-to-long term US Treasury rates will continue, eventually approaching pre-pandemic levels. The yield on the 10-year US Treasury has risen from 0.5% on August 4, 2020 to 1.08% on January 18, 2021, while it stood at 1.77% 12 months ago. According to JPM’s analysis, only US Convertibles, High Yield and Floating Rate securities can be expected to deliver modestly positive total return in the year ahead. There are other key assumptions that would change the results of their modelling, such as benign equity market conditions and a steepening yield curve, but the chart illuminates the harsh reality facing bond investors in 2021. [chart courtesy JP Morgan Asset Management © 2021]