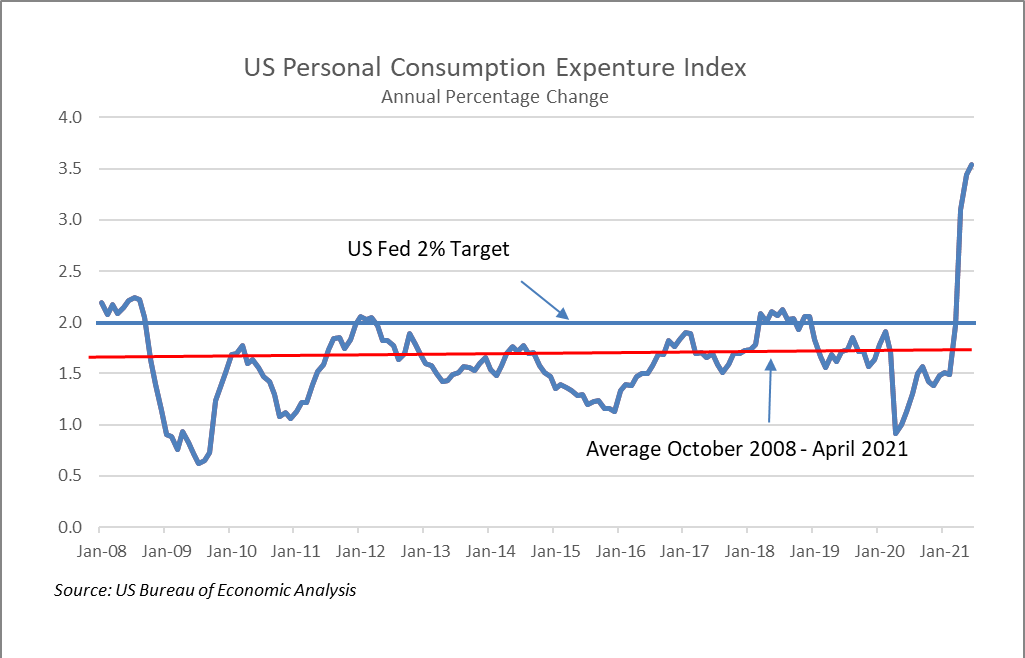
This will be our last chart before Labor Day. The US Federal Reserve’s preferred measure of inflation, the YoY rate of change in the Personal Consumption Expenditure Index (PCE), has been exceeding its 2% target rate since April making investors concerned that we may be approaching a monetary tightening cycle. That fear was escalated by this week’s release of the Fed’s July 28-29th meeting minutes that indicated they may begin to wind down the current $120 billion monthly asset purchases by the end of this year or the beginning of 2022. The Fed has expressed its view that current inflation trends are transitory and are likely due to temporary factors such as supply chain bottlenecks and a strong rebound in demand from last year’s lull in consumption. As of June 30th, the current annual rate of the PCE was 3.54%, well above the Fed’s target, but in June 2020 the reading was 1.13%. Since the Fall of 2008 during the Financial Crisis, the PCE has been stubbornly below 2%, averaging 1.59%. Over that period of nearly 13 years, the PCE has been over 2% only in Q1 2012 and for most of 2018. Inflation has been undershooting for a long period leaving aggregate price levels far below the Fed’s ideal. This suggests to us that the Fed will likely tolerate inflation until the PCE normalizes.