Looking at the markets the last several sessions, it would be easy to think this was a “hold my beer” moment after we posited the question in our last blog post about what could take these booming markets out. Right now we are saying take a moment and a healthy step back, look at the charts over the last six, twelve or eighteen months, and decide how agitated to get. Could it get worse? Sure, always could. Is there a clear reason that it should? In our opinion, not really. It does seem like the AI theme is a little exhausted after a massive run, Japan is a little exhausted after a massive run (and the carry trade may be winding down), and the jobs numbers in the US may be a bit exhausted after a massive run. In other words, a healthy consolidation after better outcomes than world markets and economies had any reason to expect after the pandemic, an overshoot on stimulus, and the consequent slamming on policy brakes. If the Middle East erupts into a hot shooting war that pulls in the West, we will need to re-rate our risk view, but right now, keep calm and look at the charts.
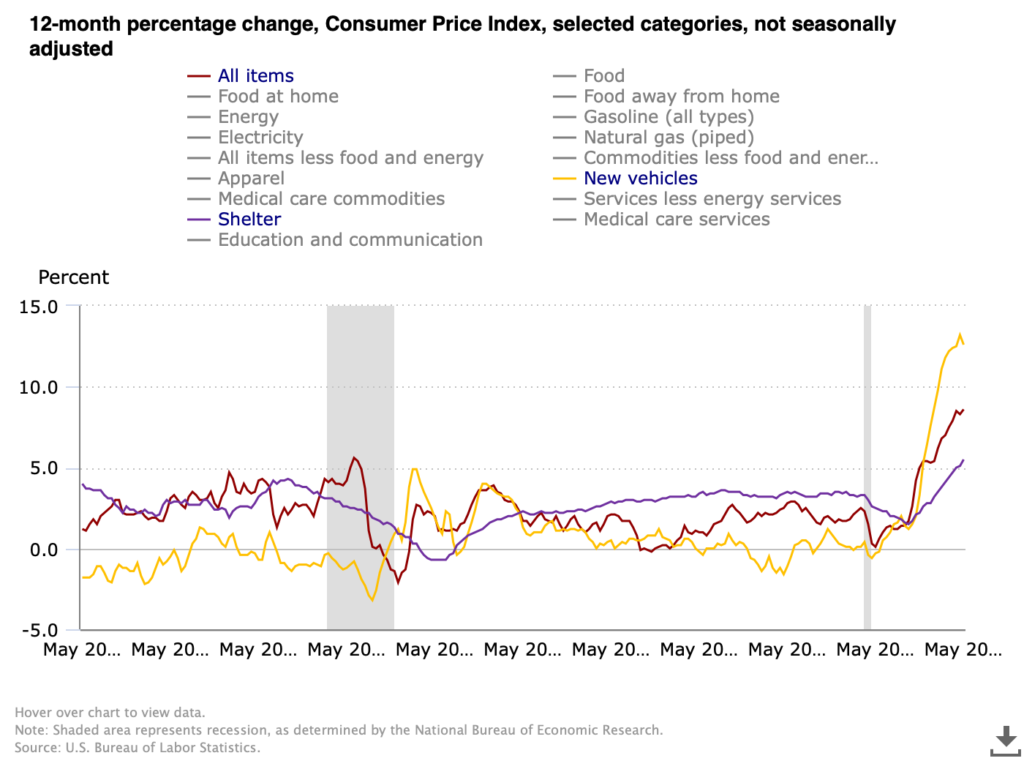
We have a new CPI print today which sent markets into a week-ending nosedive. 8.6% for May puts inflation for consumers near where it was in 1981 before the Volcker Fed cranked rates to an eye-watering 17+%. For as painful as rate increases are right now we have light years to travel before anything even remotely resembling the 80’s, nostalgia for Soviet conflict and striped shirts notwithstanding. This chart from the US Bureau of Labor Statistics compares CPI in total against two of the three components that seem ripe for a nasty mean reversion, the third being energy which we covered in the last chart and commentary. Shelter has broken out, rising to 5.5% which exceeds the lusty moments before the housing market imploded with the Financial Crisis. We have been pointing out repeatedly that there are two major moving parts driving increases in shelter — the speculative fervor over single family housing fueled by low rates, urban migration and non-human (e.g. investment fund) buyers, and the inevitable upward correction in rentals after ending pandemic moratoria on rent, rent increases and evictions. It seems likely that the single family bubble is nearing its bursting point especially as the Fed acts, but rent will continue to grind higher as the economy digests the rental disruptions of the pandemic.
New vehicles on the other hand appear perched on the precipice. Supply chain disruptions, particularly for microchips, have tightened supply and handed dealers tremendous pricing power even while makers have largely kept their price increases steady (but have been able to slow or suspend aggressive promotional programs). The rate of increase peaked at 13.2% in April and posted 12.6% for May. Other than playing demand catch-up after the market for new vehicles crashed in the depths of the Financial Crisis, the 12-month change over the last 20 years has stayed in a band of +/- 2%, and most of the time close to zero. There will come a moment when makers catch up and inventory will be abundant (and auto loan and lease rates will be higher), and the market may well punish the dealers for exploiting the situation, potentially severely. [Chart courtesy US BLS, CPI All Items, Shelter and New Vehicles, May 2002 to May 2022]
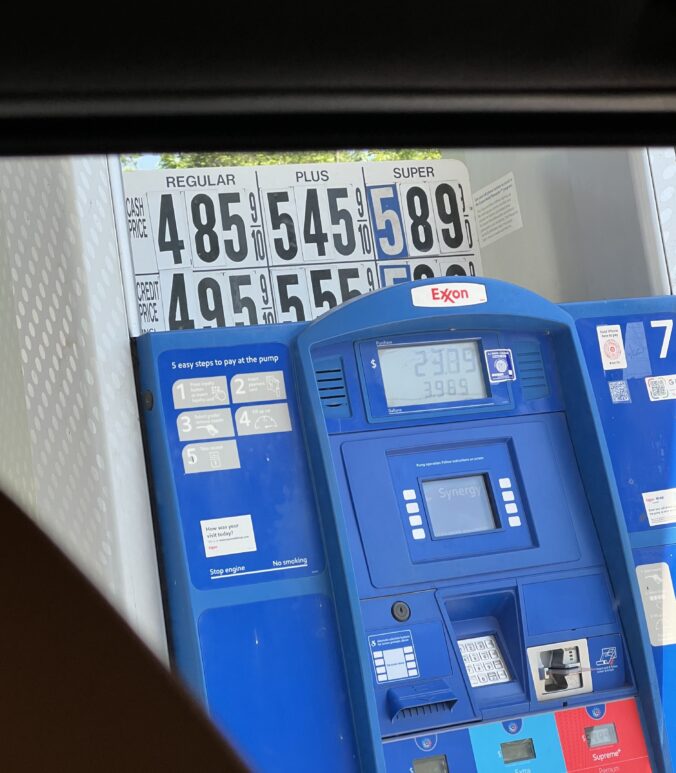
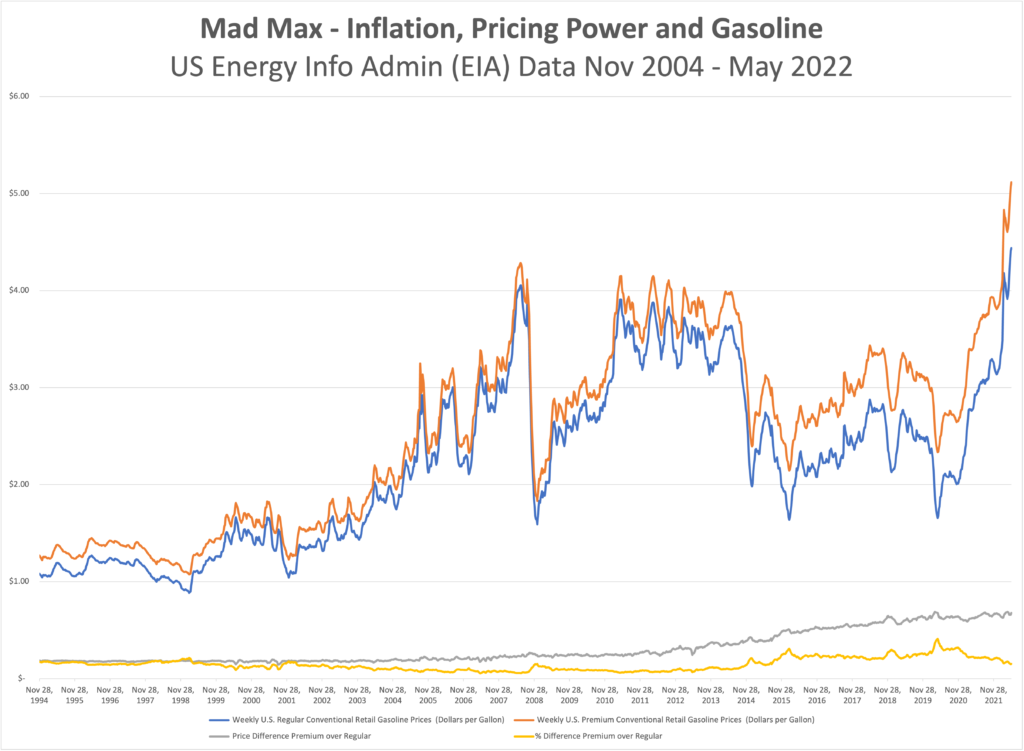
What’s up with gas? Inflation is everywhere, but it is hard to normalize when we are having the breakfast table conversations about how much prices have climbed. Our shopping carts are different from each other’s and aren’t always consistent from one trip to the next, but we get a general sense that the final tally is higher but the receipt isn’t any longer. One thing most of us, with the exception of certain urban dwellers and the small population of EV drivers, do have in common though is the price of gas. There is some geographic dispersion because of cost of delivery and local/state taxes, but we all buy the same three or four grades of gasoline, measure it in gallons, pay for it in dollars, and unless we change vehicles from one fill to the next, consume it at roughly the same rate per mile driven. This chart won’t reveal the mysteries of why prices are up, but there are a few interesting takeaways that show that there aren’t likely any easy answers. Maybe the most notable observation is that gasoline has gotten more expensive than the prior all-time peak in 2008 (about 11% higher right now). What isn’t on the graph is that oil (WTI Cushing) is about 21% cheaper than it was during the ’08 bubble.
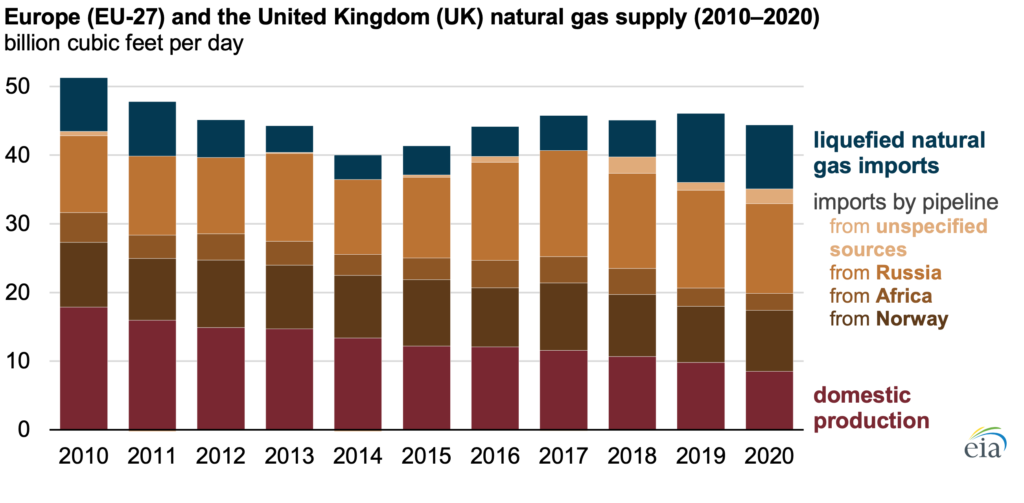
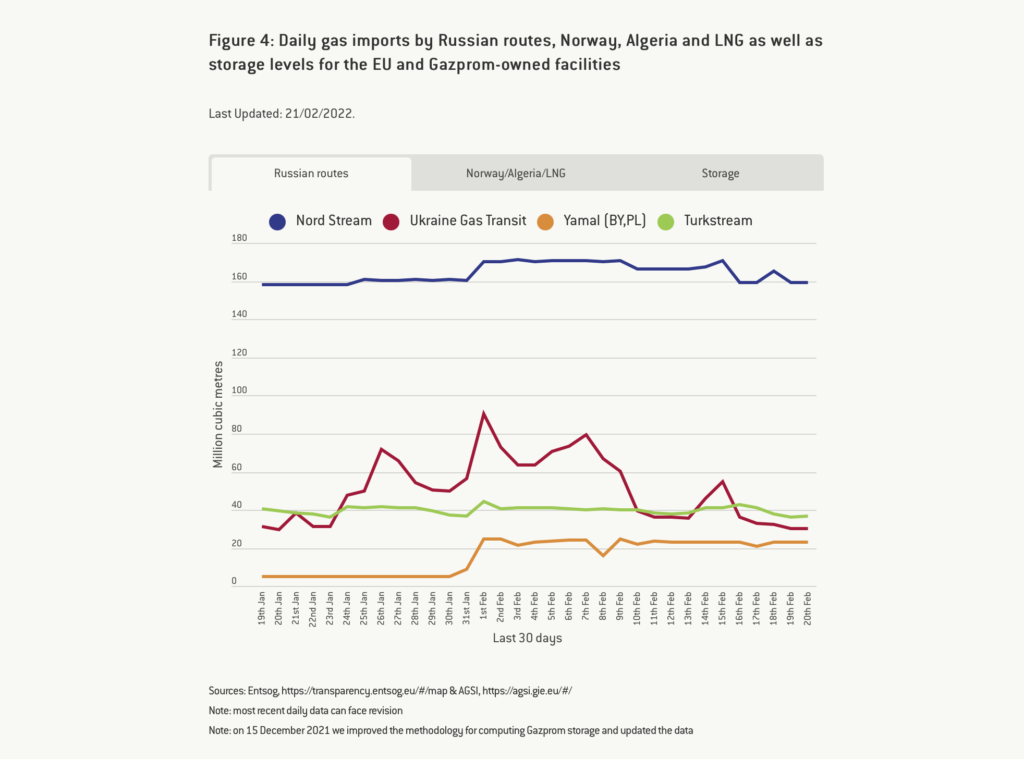
This week we get to take a break from talking about inflation to talk about… inflation. Although, in this case, what effects Russia’s moves on Ukraine might have. Russia’s economy is the 11th largest in the world as measured by nominal GDP, which seems significant until we realize it is smaller than Canada’s and 1/10 the size of China’s. Ukraine is 55th. Where Russia is most consequential in terms of their economy on the world stage is energy – petroleum and natural gas. Europe is a net importer of natural gas, a significant portion but not all of which comes from Russia. They have been increasing LNG imports from the US and Qatar, but that is mostly offset by a steady decline in domestic production. Natural gas is not the only major piece of the European energy portfolio, but it is material. Prices have already been high, and the decision to delay certifying Nord Stream 2 in response to Russian aggression means little relief is on the way. Globally, “OPEC+” has been falling short of targets to increase production post-COVID wind-down and the Ukraine conflict will not help climbing prices for oil either. The West is putting the framework for a new sanctions regime in place but that will mostly be about deciding who takes what share of the economic pain to box out Russia. Rising oil prices have similar effects on the economy as rising interest rates, so we are interested to see how the Fed digests the changing macroeconomic environment and the need to be aggressive on policy rates later in the year. Looking longer term, assuming the priority does not become preventing total war as Putin tries to reassert the borders of the former Soviet Union, we see this moment as a tipping point for Europe to accelerate their transition to a low-carbon future because it is an undeniable security imperative for the EU member states. [Sources: US Energy Information Administration https://www.eia.gov/todayinenergy/detail.php?id=51258 and McWilliams, B., G. Sgaravatti, G. Zachmann (2021) ‘European natural gas imports’, Bruegel Datasets, first published 29 October, available at https://www.bruegel.org/publications/datasets/european-natural-gas-imports/]
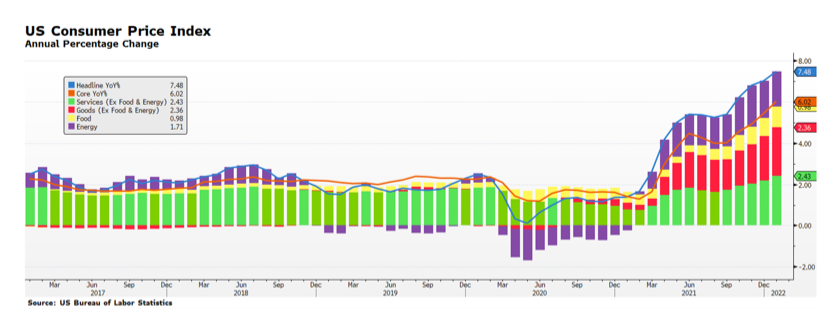
The February 10th inflation report for January was higher than expected. Key stock market gauges declined and were particularly weak toward the day’s close. Notably, all major inflation segments continue to rise — Services, Goods, and Food — with the exception of Energy, but oil and gas prices are up so far in February.
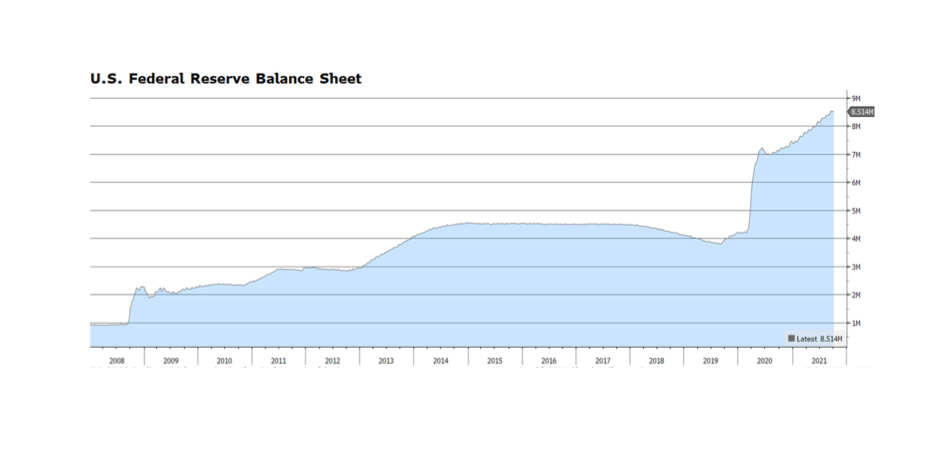
The benchmark 10Y UST yield rose above 2.0%, which has been an adverse trigger level for stocks in the recent past. The real yield on US Treasuries is more than -5%, a historic anomaly. Meanwhile, the US Federal Reserve will begin reducing its balance sheet in March. It currently stands at $8.9T, increasing over $5T since the pre-pandemic low of $3.75T, about a 134% increase since the Fall of 2019. Furthermore, the Fed is set to increase policy rates several times this year, perhaps as many as six times.
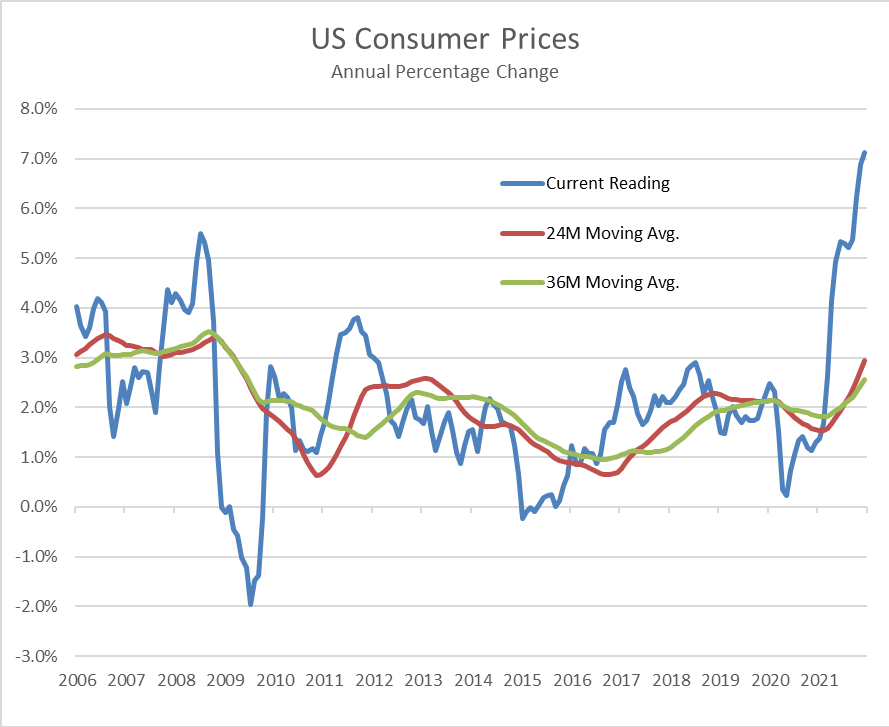
It is difficult to envision the Fed backing away from its intent to restrain monetary liquidity, especially considering that inflation trends appear to be gaining momentum. Consumer prices initially began to accelerate in March of last year, rising from 2% to about 4.5%, and had another upswing last Fall through the latest report. Headline inflation, now stands at 7.5%, a 40-year high level that very few, if any, at the Fed have had to deal with in a professional capacity.
Policy conditions are visibly changing, yet the equity market over the past couple of weeks attempted a rally from late January’s bottoms. The recent bid on US stocks could be value seekers, although the market is still fully valued if not overvalued considering a higher rate environment. It could be a response to more and more US states announcing a wind-down of COVID-era policies, or simply that capital needs a place to land and US stocks are more attractive than international equity markets or global bonds.
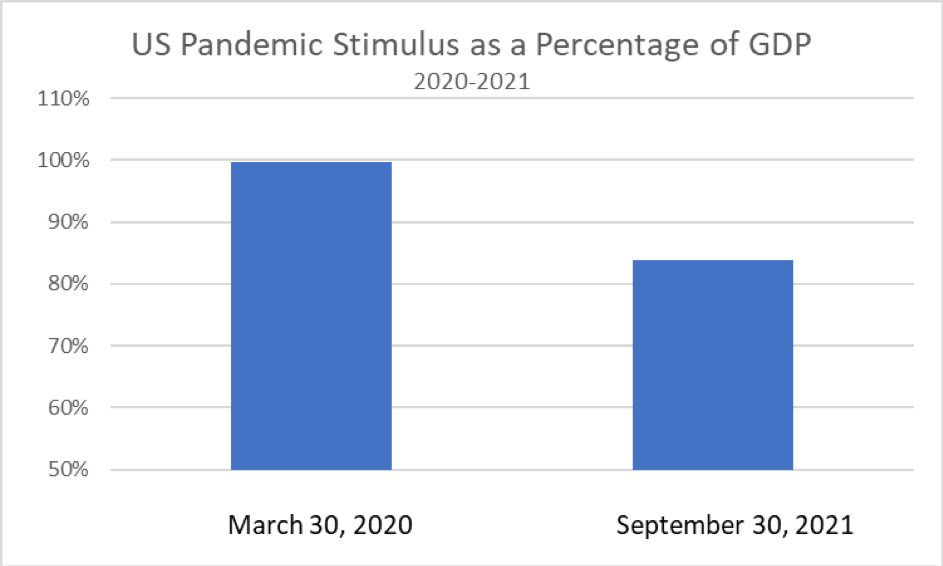
Since March 2020 the US federal government has injected an enormous amount of stimulus into the economy. There have been seven stimulus and reliefpackages ranging from the original Coronavirus Preparedness and Response Supplemental Appropriations Act to The Families First Act to the CARES Act to The Consolidated Appropriations Act and the most recent American Rescue Plan. Even without Build Back Better, this fiscal expenditure legislation amounts to nearly $15 trillion over the life of the legislation with more on the way with the new infrastructure plan. The Federal Reserve has also injected a tremendous amount of liquidity in the system by expanding its balance sheet by $4.5 trillion since March 2020 while maintaining a benign interest rate and regulatory environment. The combined government stimulus over the past twenty months amounts to over 83% of current US GDP (as of end Q3 2021). Compared to the recessionary bottom in 2020, the same stimulus is nearly 100%. By contrast, the 2009 TARP expenditure amounted to about 5% of US GDP at the time. We do not have to look far to see from where upward pressure on asset prices and inflation comes.