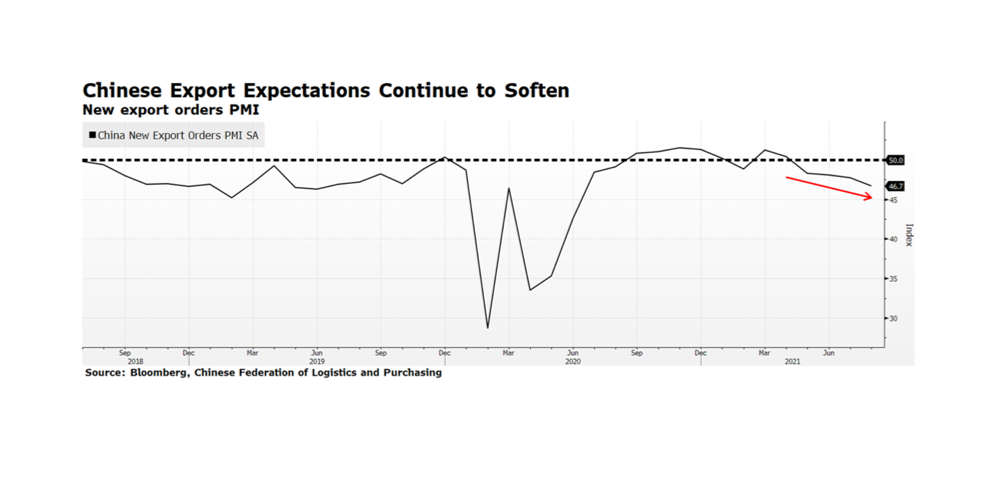
Category: Inflation (Page 2 of 2)

WCM Chart of the Week — Summer-End 2021

This will be our last chart before Labor Day. The US Federal Reserve’s preferred measure of inflation, the YoY rate of change in the Personal Consumption Expenditure Index (PCE), has been exceeding its 2% target rate since April making investors concerned that we may be approaching a monetary tightening cycle. That fear was escalated by this week’s release of the Fed’s July 28-29th meeting minutes that indicated they may begin to wind down the current $120 billion monthly asset purchases by the end of this year or the beginning of 2022. The Fed has expressed its view that current inflation trends are transitory and are likely due to temporary factors such as supply chain bottlenecks and a strong rebound in demand from last year’s lull in consumption. As of June 30th, the current annual rate of the PCE was 3.54%, well above the Fed’s target, but in June 2020 the reading was 1.13%. Since the Fall of 2008 during the Financial Crisis, the PCE has been stubbornly below 2%, averaging 1.59%. Over that period of nearly 13 years, the PCE has been over 2% only in Q1 2012 and for most of 2018.  Inflation has been undershooting for a long period leaving aggregate price levels far below the Fed’s ideal. This suggests to us that the Fed will likely tolerate inflation until the PCE normalizes.

WCM Bonus Chart for July 23, 2021

Because we took a hiatus for the holidays, we have extra thoughts to share. The US Bureau of Labor reported that consumer and producer prices came in higher than the consensus last week and that may have been part of the reason why stocks retreated. We view the consolidation in US stocks as healthy at this point, especially considering strong corporate earnings momentum and analysts increasing their earnings forecasts rather than the opposite, which oftentimes occurs at this point in the year. Forecasters usually have a difficult job but given the condition of the world during the pandemic and the incongruent economic recovery so far, it makes now even more challenging. Global bond markets are suggesting a different read on inflation and the near-term outlook for monetary policy, both benign for risk assets. The benchmark 10-year US Treasury bond yield continues its decent after the near-term peak of 1.74% on March 31st and now at 1.28%. Interestingly, government bond yields in the developed world have also fallen with equivalent US interest rates suggesting that current inflation readings are more of a temporary condition rather than a long-term concern. Disinflationary trends are starting to emerge including declining commodity prices, benign capacity utilization rates and strong productivity levels. If bond yields were trending higher along with stronger inflation readings we would be more concerned about risk assets. [chart courtesy Bloomberg LP © 2021]

WCM Chart of the Week for June 28, 2021

Since 2013, the NY Federal Reserve has been conducting a consumer survey focused on expectations for rental housing costs in the year ahead. The survey participants expect housing rental costs to soar a record 9.7% in the next 12 months, which is a major increase from the average of about 5.6% since the survey began nearly eight years ago. Survey data and other “soft” indicators, while useful, tend to lag hard data. Granted, there are also widespread reports of labor shortages and lack of transportation, but that is most likely a temporary condition. Taking this and other signals into account, we would be more concerned about inflation becoming a more permanent problem if the bond market was behaving as if the economy was moving towards that. But, the benchmark 10-year US Treasury bond yield, now standing at 1.47%, has descended from its peak of 1.74% on March 31st. Also, some key commodity prices are declining — the lumber crack spread (cited by WCM on June 14th) has fallen over 30% in two weeks. For now, we view these pockets of inflation as more of an adjustment from pandemic-created economic readings rather than a permanent progression towards higher consumer price levels. [chart courtesy NY Fed and Bloomberg LP © 2021]

WCM Chart of the Week for May 11, 2021

The US Census Bureau’s latest survey of retail sales will be reported on May 14th. The Bloomberg survey of economists’ average forecast is for a 1.0% monthly gain, adding to March’s torrid 27.9% annual pace. March’s level of over $614 billion in purchases is nearly 17% higher than the pre-pandemic level of $525.8 billion of February 2020. Consumption, the most dominant portion of the US economy, is clearly rebounding and could further stoke inflationary concerns. This is occurring as hundreds of billions of US fiscal stimulus dollars have yet to be fully deployed with potentially more on the way on top of elevated commodity prices, shortages in building materials and the labor force far from full employment levels. The Fed remains committed to QE, in effect managing the entire yield curve, and has publicly stated that it will tolerate higher inflation. But for how long? Market pressures may force the Fed to act sooner than they currently plan and that could be a major shock to the system. [chart courtesy Bloomberg LP © 2021]

Newer posts »