Category: Coronavirus (Page 1 of 5)

WCM Chart of the Week for January 18, 2022

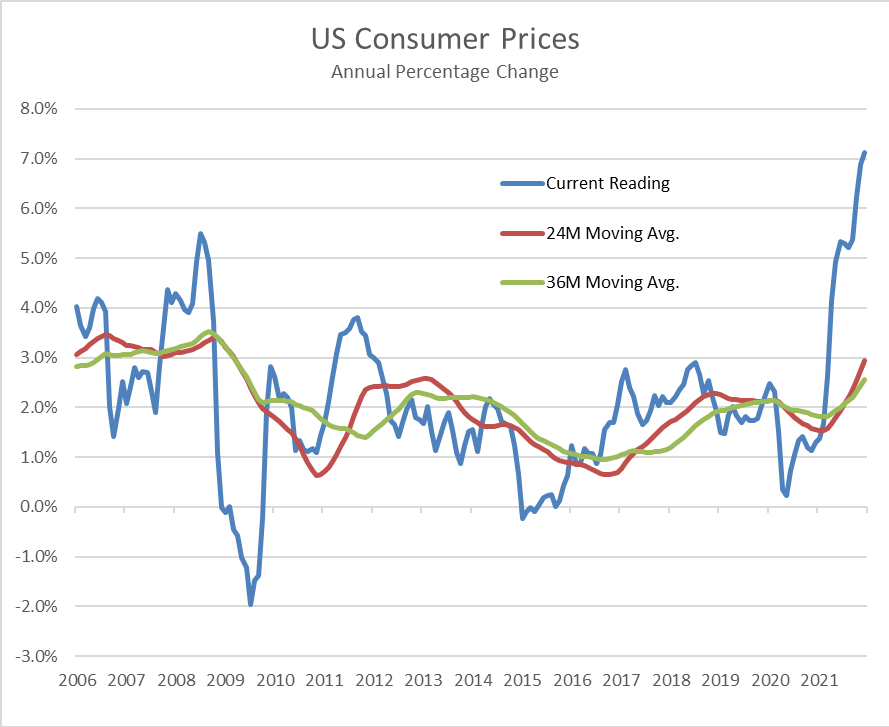
Evidence of consumer price pressure abound ranging from rising food to energy to consumer staples. Overall, US consumer prices rose over 7%, a growth rate the US has not faced since the 1980s. There are several well-documented reasons why prices have risen so rapidly, including the pandemic-forced economic shutdowns and supply chain disruptions of the past two years. How long will inflationary conditions persist, and will it become structural? Prior to the pandemic, the US was in a benign inflationary environment. Then, disinflation resulting from government-mandated shutdowns across the country suppressed prices. The annual change in US CPI averaged 1.4% from April 2020 to April 2021. The current CPI reading on December 31, 2021 is based off pandemic nadir levels, and the base effect may lead to higher “headline” inflation in the months ahead. However, if annual gains in consumer prices fail to keep pace with the high inflation trends of 2021 [which include 2020’s low base effect], forward looking inflation could moderate. Capital markets will likely remain on edge, and the US Federal Reserve will be challenged balancing appropriate monetary policy against inflationary trends that may prove temporary, but also may not. (chart © 2022 Wilde Capital Management, data from Bureau of Labor Statistics)

WCM Chart of the Week for December 6, 2021

Through the end of November, the S&P 500 has delivered a robust 23.2% year-to-date total return, piling on to2020’s impressive full-year 18.4% clip. On its face, such strong stock market results would seem implausible given the disruptive forces of the pandemic, the multiple variants and building inflationary pressure here and abroad. The S&P 500 reached its pandemic bottom on March 23, 2020 and since then, the 20 month-end observations of rolling annual returns (shown on the chart) have averaged over 25.8%. To place that figure in context, the long-term average annual return since inception in 1987 is 12.38%. The low “base effect” climbing up from the pandemic bottom contributed to the relative strong % gains over the past twenty months, but there are also significant macro factors that have supported a booming US stock market that may prove to be headwinds going forward. [chart data courtesy Standard & Poors, Bloomberg LP © 2021]

WCM Chart of the Week for November 10, 2021

There were several positive aspects of last week’s BLS report on labor market conditions. Unemployment fell to 4.6% showing steady progress towards the multi-decade lows experienced prior to the pandemic. However, the overall labor market participation rate, at 61.6%, may be stagnating. Segmenting key age group participation rates (shown in this chart) unmasks a troubling trend — younger workers in the 18-24 year age bracket and prime aged workers in the 25-54 year old demographic are steadily returning to the workforce while older workers are not. Furthermore, participation in this older segment of the labor pool has receded to pandemic lows. There are several reasons for this, ranging from the natural consequence of an aging population to credible fears of viral and variant infections compounded by a booming stock market that has inflated retirement accounts potentially advancing planned retirement dates. Fewer people working, whether by choice or not, leads to lower tax receipts at a time when the US has persistent fiscal deficits. [chart courtesy of BLS, Bloomberg LP © 2021]

WCM Chart of the Week — Summer-End 2021

This will be our last chart before Labor Day. The US Federal Reserve’s preferred measure of inflation, the YoY rate of change in the Personal Consumption Expenditure Index (PCE), has been exceeding its 2% target rate since April making investors concerned that we may be approaching a monetary tightening cycle. That fear was escalated by this week’s release of the Fed’s July 28-29th meeting minutes that indicated they may begin to wind down the current $120 billion monthly asset purchases by the end of this year or the beginning of 2022. The Fed has expressed its view that current inflation trends are transitory and are likely due to temporary factors such as supply chain bottlenecks and a strong rebound in demand from last year’s lull in consumption. As of June 30th, the current annual rate of the PCE was 3.54%, well above the Fed’s target, but in June 2020 the reading was 1.13%. Since the Fall of 2008 during the Financial Crisis, the PCE has been stubbornly below 2%, averaging 1.59%. Over that period of nearly 13 years, the PCE has been over 2% only in Q1 2012 and for most of 2018.  Inflation has been undershooting for a long period leaving aggregate price levels far below the Fed’s ideal. This suggests to us that the Fed will likely tolerate inflation until the PCE normalizes.

WCM Chart of the Week for June 14, 2021

Consumers of lumber products may finally see an end to soaring prices. Lumber crack spreads (the difference in prices of finished lumber and raw timber) have been rapidly falling since peaking in early May. Specifically, the measure on this week’s chart uses the CME futures spot rate of random length softwood 2x4s used in construction minus the Timber Mart-South US Louisiana Pine Sawtimber spot rate. Both indices are falling with finished board prices falling at a faster pace.

There are a variety of reasons why finished lumber prices surged, ranging from a beetle infestation in western Canada and the US Pacific Northwest, strong pandemic-stimulated single family housing demand, glue shortages related to the storm-induced petrochemical plant shutdowns in Texas earlier in the year, and a lack of truckers and workers for sawmills. This confluence of events may be playing out in other industries and be part of why the Fed considers rising key consumer and producer prices transitory and not permanent. Nonetheless, inflationary concerns that recently unnerved the capital markets will likely continue to arise for some time to come. [chart courtesy Bloomberg LP © 2021]

The clock is ticking. What does that mean for investors?

Another trip around the sun leading to another Earth Day, our second of the pandemic. Amid all the trauma, last year we got a brief glimpse of what hitting the pause button on our use and overuse of the planet would yield. Fresher air, cleaner water, wildlife in the canals and in the streets. We conducted an unintended (and unwanted), all-in global experiment, and graphically demonstrated that the environment does have the capacity to respond to behavioral change on the part of humans.

Stopping everything isn’t the answer. But changing everything could be. This planetary test case provided strong evidence against the argument that global systems are too vast and too complex, and changing human patterns wouldn’t result in any sort of improvement. A change from extractive to regenerative processes in food, energy, materials, housing, and transportation among others not only can help address the challenge of sufficiency but also manage our footprint so we live with rather than just on Earth. There is still time to stop and possibly even partially reverse the mounting damage to atmospheric, oceanic, littoral, arborial and other global systems. The risk of not taking those steps is existential for humanity, and it is also bad capitalism. Wildfire, inundation, desertification, loss of pollinators, extreme weather, even glacial collapse have real economic consequences from interrupting supply chains to destroying value in the billions and trillions of dollars.

Moving to more regenerative businesses and communities will mitigate or even prevent some of these risks from manifesting, and will be more equitable and inclusive and result in more financial opportunity for individuals and entire markets. The best possible investment is one that both reduces risk and catalyzes growth at the same time. Caring for the planet we live with is also the best possible free option to get on that trade.

#TurtleIsland

WCM Chart of the Week for April 19, 2021

We can’t leave Women’s History Month completely in the rear-view mirror without taking a long and hard look at how impossibly difficult it is for women founders to obtain venture capital funding for their early-stage enterprises. COVID-19 was certainly no friend either, leaving 2020 as the worst year in the last five for women. As compiled by Crunchbase (news.crunchbase.com), a paltry 2% of funding went to women-led startups in 2020, a figure which obnoxiously more than quadruples to 9% with a male co-founder but is still an embarrassment.  The system is not just biased – it is broken. There is no credible case that can be made that, out of a universe comprising more than half the world’s population and representing more than half of the Associates, Bachelors, Masters AND Doctorates awarded just in the US, women barely represent even one fiftieth of the economic potential of men to investors. Next time the question is asked about how we continue to grow the global economy and unlock the full potential of the capital markets given all the headwinds we face, give this answer – Invest. In. Women… Now. And particularly invest in black, indigenous, and other women of color. [chart from Crunchbase News, © 2020]

WCM Chart of the Week for March 29, 2021

It has been just over a year since stocks around the world began to recover from the pandemic-driven sell off. Stocks in the US found their bottom around March 23, 2020.  Since then, returns have been unusually strong with small cap stocks leading the way with the Russell 2000 Index up 115% and the Nasdaq Composite up nearly 90%. The rebound is not so surprising given the amount of fiscal and monetary stimulus that has been injected into the economy over the past year. The fiscal stimulus including the CARES Act, PPP, Consolidated Appropriations and the American Rescue Plan amount to over $5.4 trillion, while the Federal Reserve has expanded its balance sheet by nearly $3.6 trillion. Taken together, the stimulus efforts amount to over 43% of 2020 US GDP with even more potential fiscal plans. To place the astronomical stimulus in context, the Bureau of Economic Analysis (BEA) announced on March 25th that US GDP contracted 3.5% in the full year 2020. The BEA also announced its Q4 2020 GDP estimate indicating expansion at a 4.3% pace following Q3 growth of 33.4%. With the economy clearly on a strong path to recovery, we see continued stimulus as potentially overkill, at least in market terms, and the excess liquidity will likely produce further gains in stocks in the months ahead. [chart courtesy Bloomberg LP © 2021]

WCM Chart of the Week for February 22, 2021

As we pass through the 12-month mark of the pandemic-caused rout in equities and risk assets across the world, investors are concerned about stretched stock market valuations, tight investment grade and high yield credit spreads, rising interest rates and poor labor market conditions. As of February 22nd, the one-year total return on the S&P 500 is just over 18% which is significant by any historical measure. As the next month or so passes, and as long as equity prices stay near where they are now, trailing returns are likely to grow even stronger as the anniversary of the March 23rd market bottom approaches. This may provide an additional psychological boost for investors as more stimulus is poured into the economy. Our concern is that the tremendous forthcoming stimulus now being debated in Congress might not be fully needed, or at least might not be properly apportioned. The stimulus may propel stocks higher here and abroad but may force the US Fed, which remains the dominant force in global capital markets, to reign in liquidity sooner than the market anticipates. [chart courtesy Standard & Poors and Bloomberg LP ©2021]

WCM Chart of the Week for December 7, 2020

This week we are in the midst of examining the likelihood of a pandemic-induced housing crisis and its effects on families, the economy, and markets.  As we learned during the Financial Crisis, it is a very slow process to foreclose on a mortgagee and remove them from a home, particularly when there is a massive backlog of borrowers in similar circumstances. Renters, on the other hand, are more immediately vulnerable to eviction and subsequent homelessness. This week’s chart from econofact.org illustrates the percentage of households suffering a moderate or extreme cost-burden of rent (30% to 50% of income) by household income tier. These observations are pre-COVID, so we can reasonably expect this picture to be much worse in 2020. Government-issued moratoria on evictions kept people in their homes but also shifted the economic burden to the literal doorstep of landlords, many of whom are small businesses. As those edicts roll off but the pandemic still rages in the coming months, landlords will of necessity pursue their economic and business interests and housing insecurity will jump. Whether it is on the backs of the landlords or the renters, the social and economic consequences of this income and housing crisis will play out in our communities, in the real economy and in the investment markets for some time to come.

« Older posts