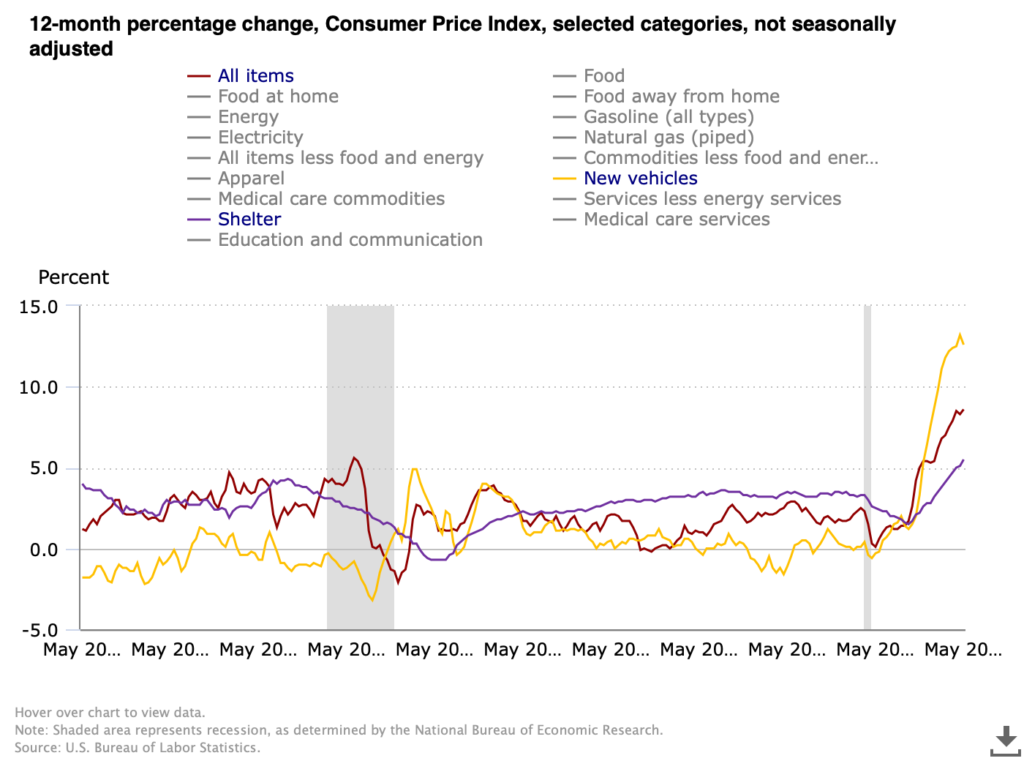
We have a new CPI print today which sent markets into a week-ending nosedive. 8.6% for May puts inflation for consumers near where it was in 1981 before the Volcker Fed cranked rates to an eye-watering 17+%. For as painful as rate increases are right now we have light years to travel before anything even remotely resembling the 80’s, nostalgia for Soviet conflict and striped shirts notwithstanding. This chart from the US Bureau of Labor Statistics compares CPI in total against two of the three components that seem ripe for a nasty mean reversion, the third being energy which we covered in the last chart and commentary. Shelter has broken out, rising to 5.5% which exceeds the lusty moments before the housing market imploded with the Financial Crisis. We have been pointing out repeatedly that there are two major moving parts driving increases in shelter — the speculative fervor over single family housing fueled by low rates, urban migration and non-human (e.g. investment fund) buyers, and the inevitable upward correction in rentals after ending pandemic moratoria on rent, rent increases and evictions. It seems likely that the single family bubble is nearing its bursting point especially as the Fed acts, but rent will continue to grind higher as the economy digests the rental disruptions of the pandemic.
New vehicles on the other hand appear perched on the precipice. Supply chain disruptions, particularly for microchips, have tightened supply and handed dealers tremendous pricing power even while makers have largely kept their price increases steady (but have been able to slow or suspend aggressive promotional programs). The rate of increase peaked at 13.2% in April and posted 12.6% for May. Other than playing demand catch-up after the market for new vehicles crashed in the depths of the Financial Crisis, the 12-month change over the last 20 years has stayed in a band of +/- 2%, and most of the time close to zero. There will come a moment when makers catch up and inventory will be abundant (and auto loan and lease rates will be higher), and the market may well punish the dealers for exploiting the situation, potentially severely. [Chart courtesy US BLS, CPI All Items, Shelter and New Vehicles, May 2002 to May 2022]

