Category: Transportation

WCM Chart for June 10, 2022

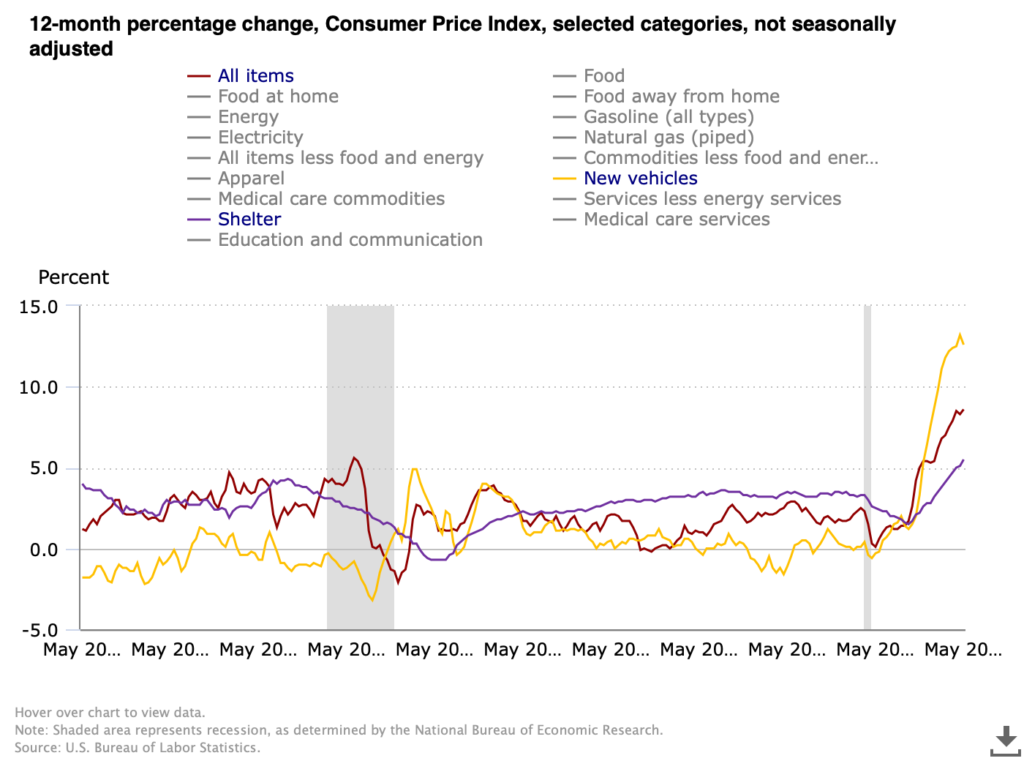
We have a new CPI print today which sent markets into a week-ending nosedive. 8.6% for May puts inflation for consumers near where it was in 1981 before the Volcker Fed cranked rates to an eye-watering 17+%. For as painful as rate increases are right now we have light years to travel before anything even remotely resembling the 80’s, nostalgia for Soviet conflict and striped shirts notwithstanding. This chart from the US Bureau of Labor Statistics compares CPI in total against two of the three components that seem ripe for a nasty mean reversion, the third being energy which we covered in the last chart and commentary. Shelter has broken out, rising to 5.5% which exceeds the lusty moments before the housing market imploded with the Financial Crisis. We have been pointing out repeatedly that there are two major moving parts driving increases in shelter — the speculative fervor over single family housing fueled by low rates, urban migration and non-human (e.g. investment fund) buyers, and the inevitable upward correction in rentals after ending pandemic moratoria on rent, rent increases and evictions. It seems likely that the single family bubble is nearing its bursting point especially as the Fed acts, but rent will continue to grind higher as the economy digests the rental disruptions of the pandemic.

New vehicles on the other hand appear perched on the precipice. Supply chain disruptions, particularly for microchips, have tightened supply and handed dealers tremendous pricing power even while makers have largely kept their price increases steady (but have been able to slow or suspend aggressive promotional programs). The rate of increase peaked at 13.2% in April and posted 12.6% for May. Other than playing demand catch-up after the market for new vehicles crashed in the depths of the Financial Crisis, the 12-month change over the last 20 years has stayed in a band of +/- 2%, and most of the time close to zero. There will come a moment when makers catch up and inventory will be abundant (and auto loan and lease rates will be higher), and the market may well punish the dealers for exploiting the situation, potentially severely. [Chart courtesy US BLS, CPI All Items, Shelter and New Vehicles, May 2002 to May 2022]
WCM Chart for June 2, 2022

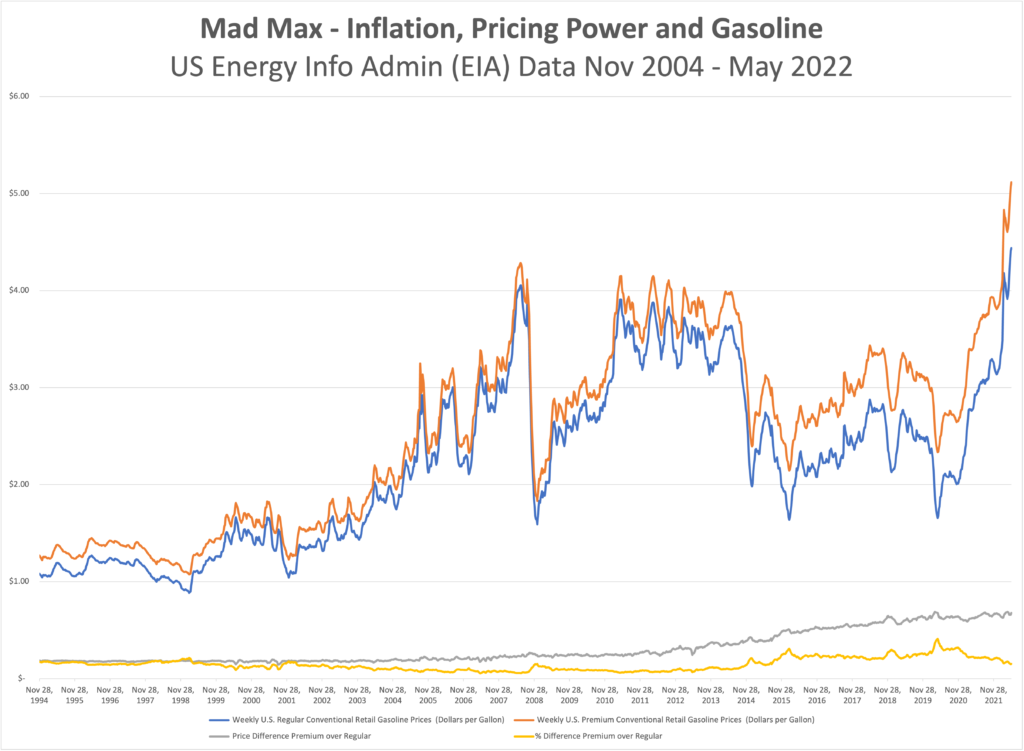
What’s up with gas? Inflation is everywhere, but it is hard to normalize when we are having the breakfast table conversations about how much prices have climbed. Our shopping carts are different from each other’s and aren’t always consistent from one trip to the next, but we get a general sense that the final tally is higher but the receipt isn’t any longer. One thing most of us, with the exception of certain urban dwellers and the small population of EV drivers, do have in common though is the price of gas. There is some geographic dispersion because of cost of delivery and local/state taxes, but we all buy the same three or four grades of gasoline, measure it in gallons, pay for it in dollars, and unless we change vehicles from one fill to the next, consume it at roughly the same rate per mile driven. This chart won’t reveal the mysteries of why prices are up, but there are a few interesting takeaways that show that there aren’t likely any easy answers. Maybe the most notable observation is that gasoline has gotten more expensive than the prior all-time peak in 2008 (about 11% higher right now). What isn’t on the graph is that oil (WTI Cushing) is about 21% cheaper than it was during the ’08 bubble.

Back to the chart, we can see that the spread between premium and regular gas has been steadily grinding higher for years, with few interruptions in the relationship outside of brief reactions to the Tech Bubble, 9/11, the Financial Crisis, etc. For those old enough to remember, it was bankable that mid-grade was 10 cents more than regular, and premium was ten cents more than that. Now that premium/regular spread hovers between 65 and 70 cents, today and two years ago when everyone was hunkered down at home. These figures would indicate that the petro industry still enjoys tremendous pricing power. When thinking about inflation it is important to consider what the drivers are and who gets hurt, but also who benefits. It was almost exactly 11 years ago when WTI was the same price it is today ($112/bbl). Regular was $3.91, and Premium was $4.15. Today at $112/bbl, Regular is $4.44 and Premium $5.12. [chart © WCM 2022, national data from US Energy Information Administration (EIA)]

WCM Chart of the Week for April 14, 2022

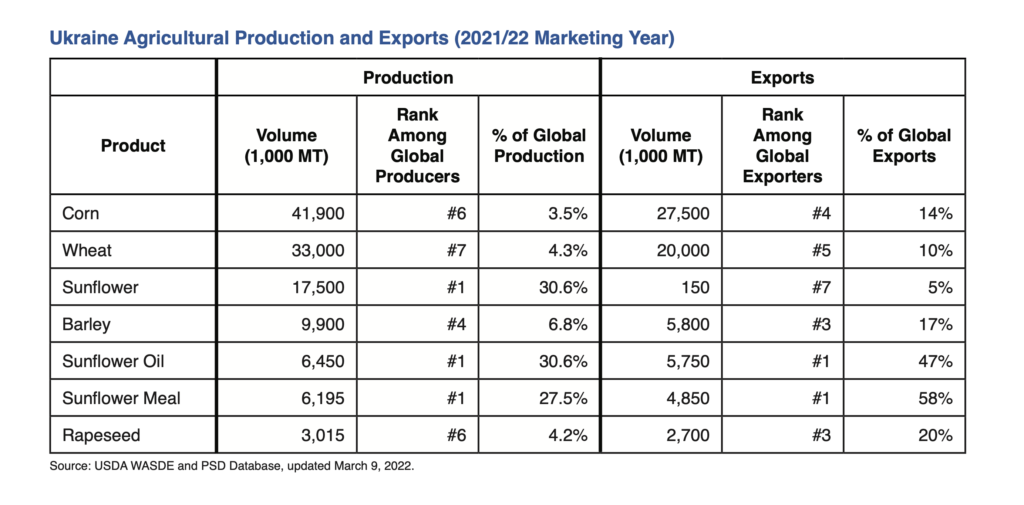
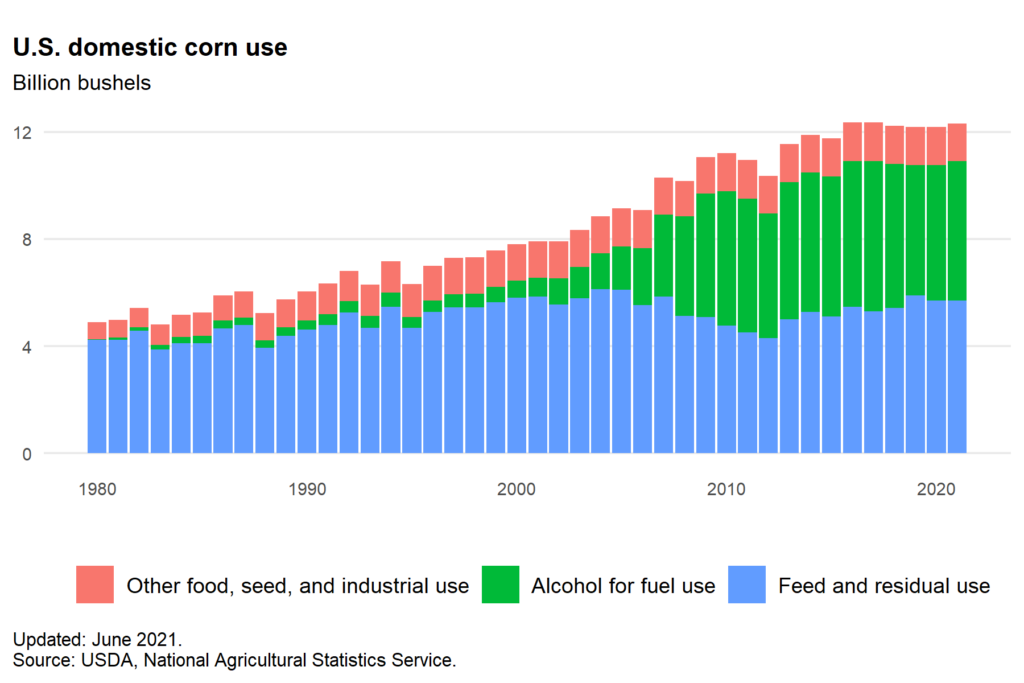
Let’s talk about something that proves that short-sighted or wrong-headed decisionmaking in ESG is bipartisan. One of the incredibly unfortunate halo effects of the Ukraine conflict is the global food shortage caused by Europe’s breadbasket being at war and the sanctions limiting access to Russian natural gas (key source for fertilizer). In addition to placing at risk a large percentage of the world population that are already nutritionally insecure, it has the effect of driving up commodity and food prices in the developed West. As we have discussed in prior blogs and newsletters, the conflict has also destabilized the petroleum market because of Russia’s role as a petrostate. The US is effectively energy independent, or nearly so if we look at all of North America together, but no question energy prices are higher. So what’s an American to do in the face of a global food and energy crisis? The US administration has an answer – put food in your gas tank. The decision to move to E15, 15% anhydrous denatured alcohol in the fuel mix, for the Summer arguably makes the whole situation worse. Referring to the US Energy Information Administration, the ASTM D4806 specification for ethanol compatible with spark-ignition engines is produced by “fermenting the sugar in the starches of grains such as corn, sorghum, and barley, and the sugar in sugar cane and sugar beets”. The first chart is from the USDA Foreign Agricultural Service and shows just how material Ukraine is to the global food supply. The second from the USDA statistics service shows already how much US corn production goes to fuel. There is a whole additional discussion to be had about the sense or senselessness of grain and cane crops being turned into fuel, from the energy intensity of the chemical conversion to the natural gas used to make fertilizer to the diesel burned for farm equipment to the climate costs of unsustainable monocrop farming practices that strongly suggests shortening the path from drill bit to burner tip is more efficient. But right now, we are focusing on the fact the US could (profitably) ameliorate rising food scarcity and prices with the same agricultural products it is planning to ferment and burn to save 10 cents on a $5 gallon of gas at the pump.

Charting COP-26 — Is that a pie in the sky?

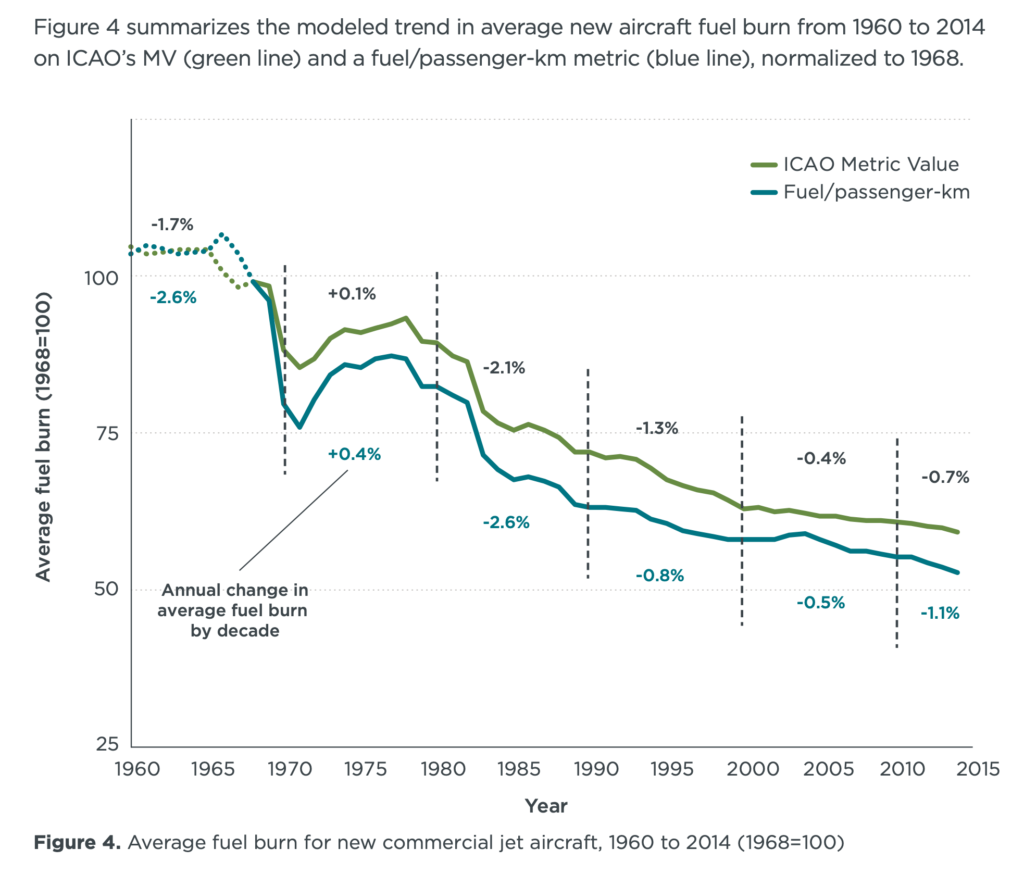
Today at COP-26 we received a declaration entitled “INTERNATIONAL AVIATION CLIMATE AMBITION COALITION”. Commercial aviation is a non-trivial contributor to GhG emissions. The widely cited statistic is that, if the industry were a nation, total output would rank it 7th after Germany. From a climate policy point of view though, we are asking whether the focus is correct on the part of policymakers and signatory nations. The International Civil Aviation Association (ICAO) already set goals a decade ago of improving efficiency by 2% per year, which was not out of line with historical trends. Improvements in jet engine efficiency along with innovations in avionics and lighter airframes have led to steady increases in efficiency per passenger seat for decades. It makes absolute commercial sense because of the amount of the economics of air transportation consumed by fuel costs. Each generation of aircraft upgrades provides significant improvements. Fuel burn for new aircraft fell by nearly half from 1968 to 2014. We are questioning the focus because unlike other industries like power generation, there are no viable alternatives on the visible horizon. Coal plants can be decommissioned in favor of natural gas, or going all the way to wind, solar, hydro, etc. ICE cars and trucks can be replaced with EVs. There is no EV plane (yet). The industry is doing its part in terms of innovation and of course there is room to do more. The real burden is behavioral though, and yet that is nowhere to be found in the COP statement. There are commitments to alternative fuels and technologies, but nothing about curbing unnecessary air travel, making more efficient aircraft affordable for developing nations rather than selling them hand-me-down decades-old aircraft, or changing the business mix to favor flying larger and more efficient airframes over the explosion in use of small, less efficient, commuter aircraft for many routes. [chart from International Council on Clean Transportation, Fuel Efficiency Trends for New Commercial Jet Aircraft: 1960 to 2014, Anastasia Kharina, Daniel Rutherford, Ph.D.]