Category: Housing

WCM Chart for June 10, 2022

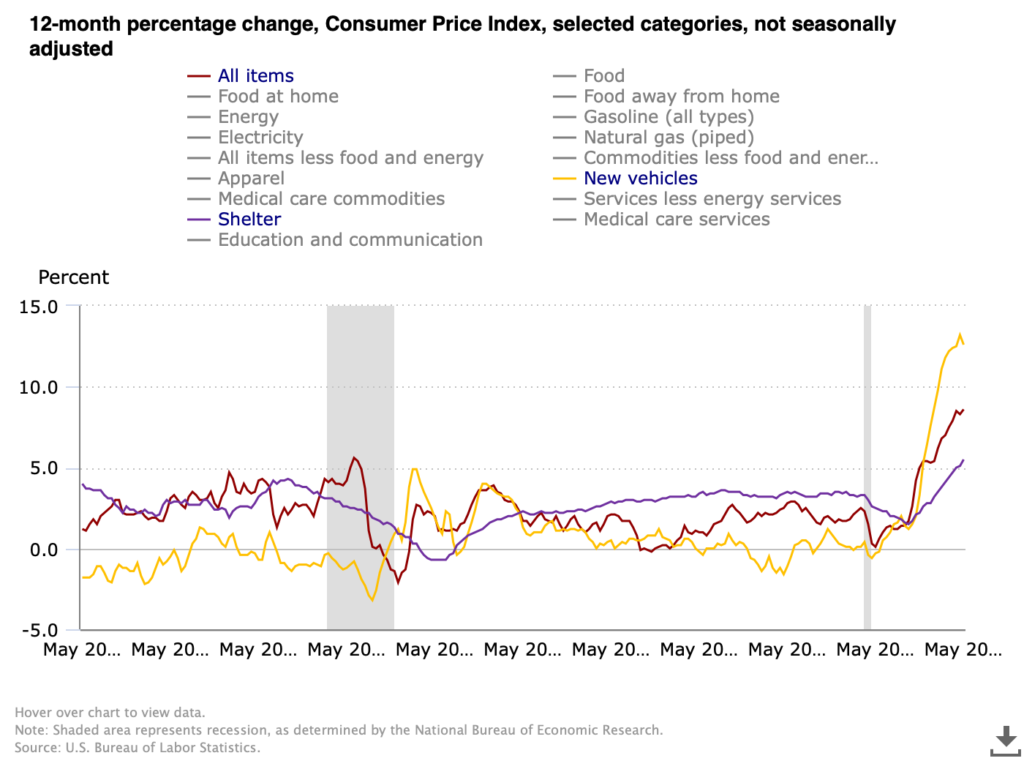
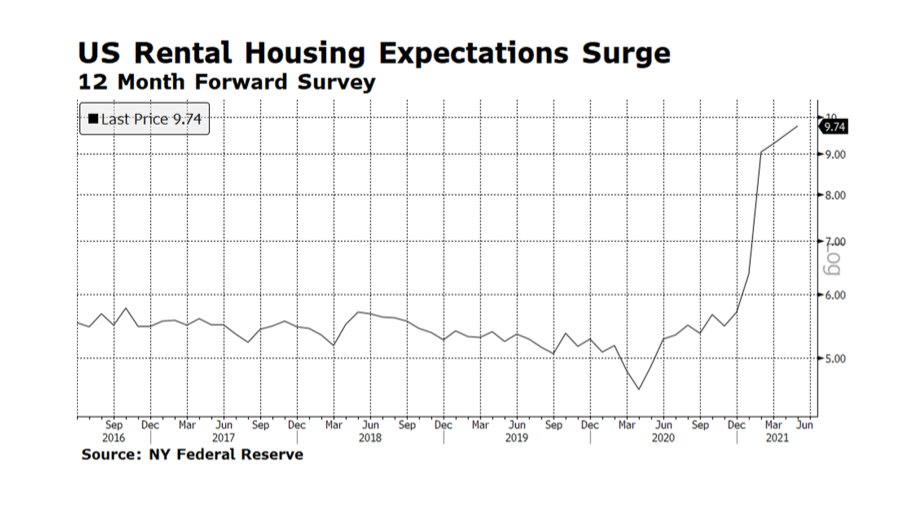
We have a new CPI print today which sent markets into a week-ending nosedive. 8.6% for May puts inflation for consumers near where it was in 1981 before the Volcker Fed cranked rates to an eye-watering 17+%. For as painful as rate increases are right now we have light years to travel before anything even remotely resembling the 80’s, nostalgia for Soviet conflict and striped shirts notwithstanding. This chart from the US Bureau of Labor Statistics compares CPI in total against two of the three components that seem ripe for a nasty mean reversion, the third being energy which we covered in the last chart and commentary. Shelter has broken out, rising to 5.5% which exceeds the lusty moments before the housing market imploded with the Financial Crisis. We have been pointing out repeatedly that there are two major moving parts driving increases in shelter — the speculative fervor over single family housing fueled by low rates, urban migration and non-human (e.g. investment fund) buyers, and the inevitable upward correction in rentals after ending pandemic moratoria on rent, rent increases and evictions. It seems likely that the single family bubble is nearing its bursting point especially as the Fed acts, but rent will continue to grind higher as the economy digests the rental disruptions of the pandemic.

New vehicles on the other hand appear perched on the precipice. Supply chain disruptions, particularly for microchips, have tightened supply and handed dealers tremendous pricing power even while makers have largely kept their price increases steady (but have been able to slow or suspend aggressive promotional programs). The rate of increase peaked at 13.2% in April and posted 12.6% for May. Other than playing demand catch-up after the market for new vehicles crashed in the depths of the Financial Crisis, the 12-month change over the last 20 years has stayed in a band of +/- 2%, and most of the time close to zero. There will come a moment when makers catch up and inventory will be abundant (and auto loan and lease rates will be higher), and the market may well punish the dealers for exploiting the situation, potentially severely. [Chart courtesy US BLS, CPI All Items, Shelter and New Vehicles, May 2002 to May 2022]

WCM Chart of the Week for June 28, 2021

Since 2013, the NY Federal Reserve has been conducting a consumer survey focused on expectations for rental housing costs in the year ahead. The survey participants expect housing rental costs to soar a record 9.7% in the next 12 months, which is a major increase from the average of about 5.6% since the survey began nearly eight years ago. Survey data and other “soft” indicators, while useful, tend to lag hard data. Granted, there are also widespread reports of labor shortages and lack of transportation, but that is most likely a temporary condition. Taking this and other signals into account, we would be more concerned about inflation becoming a more permanent problem if the bond market was behaving as if the economy was moving towards that. But, the benchmark 10-year US Treasury bond yield, now standing at 1.47%, has descended from its peak of 1.74% on March 31st. Also, some key commodity prices are declining — the lumber crack spread (cited by WCM on June 14th) has fallen over 30% in two weeks. For now, we view these pockets of inflation as more of an adjustment from pandemic-created economic readings rather than a permanent progression towards higher consumer price levels. [chart courtesy NY Fed and Bloomberg LP © 2021]

WCM ESG Week — Theme 2: Banking the Un(der)banked

Deposits in the United States are insured by one of two federal agencies: the Federal Deposit Insurance Corporation or the National Credit Union Administration. In the first quarter of 2021, the Federal Deposit Insurance Corporation reported 4,978 current FDIC-insured commercial banking and savings institutions in the United States providing banking and credit services. In addition, the FDIC acts as the federal supervisor to another 3,209 state-chartered banks and savings institutions in the United States that are not members of the Federal Reserve system. These FDIC-insured and supervised institutions serviced in total over $22 trillion in assets as of quarter one 2021 (FDIC, 2021). In the same time frame, the NCUA reported a total of 5,068 federally insured credit unions servicing $1.95 trillion in assets to over 125 million customers (NCUA, 2021). So, what does it mean to be underbanked or unbanked in one of the richest and most prosperous countries in the world?

Every two years since 2009, the FDIC conducts a household survey in cooperation with the U.S. Census Bureau on the use of banking and financial services in the United States. The survey collects responses from approximately 33,000 households to analyze trends in the financial services industry by geographical, demographic, and economic factors.  The last survey, conducted in 2019, estimated 5.4% of U.S. households were unbanked, meaning that no household member had a checking or savings account at a bank or credit union. This percentage represents approximately 7.1 million households.  Unbanked rates were higher amongst lower-income, less-educated, and Black, Hispanic, and American Indian or Alaska Native households. Among households reported as unbanked, 48.9% cited the reason for not having an account as, “don’t have enough money to meet the minimum balance requirements” (FDIC, 2019). Furthermore, according to a survey conducted in 2019 by the Federal Reserve, an additional 16% of adults are underbanked in the United States, meaning they have a bank account but still use other alternative financial service products such as money orders or pawn shop loans due to lack of affordability or access to traditional and more secure products (Federal Reserve, 2017).

On a global scale, 1.7 billion adults are reported as unbanked in 2017, with China and India accounting for almost 325 million unbanked individuals alone. Women disproportionally represent 56 percent of all unbanked individuals globally (Findex, 2017). Lack of access to traditional banking services hinders individuals’ ability to build emergency funding, execute financial transactions such as paying bills or cashing checks, and results in a lack of access to credit.

Tune into our Wilde Capital Management ESG Week podcast Day 2: Banking the Un(der)banked where we explore financial services trends with Justin Conway, Vice President of Investment Partnerships at Calvert Impact Capital.

https://www.federalreserve.gov/publications/2019-economic-well-being-of-us-households-in-2018-banking-and-credit.htm

https://globalfindex.worldbank.org/sites/globalfindex/files/chapters/2017%20Findex%20full%20report_chapter2.pdf

https://www.ncua.gov/files/publications/analysis/industry-at-a-glance-march-2021.pdf

https://www.ncua.gov/files/publications/analysis/industry-at-a-glance-march-2021.pdf

https://www.fdic.gov/analysis/quarterly-banking-profile/statistics-at-a-glance/2021mar/industry.pdf

WCM Chart of the Week for June 14, 2021

Consumers of lumber products may finally see an end to soaring prices. Lumber crack spreads (the difference in prices of finished lumber and raw timber) have been rapidly falling since peaking in early May. Specifically, the measure on this week’s chart uses the CME futures spot rate of random length softwood 2x4s used in construction minus the Timber Mart-South US Louisiana Pine Sawtimber spot rate. Both indices are falling with finished board prices falling at a faster pace.

There are a variety of reasons why finished lumber prices surged, ranging from a beetle infestation in western Canada and the US Pacific Northwest, strong pandemic-stimulated single family housing demand, glue shortages related to the storm-induced petrochemical plant shutdowns in Texas earlier in the year, and a lack of truckers and workers for sawmills. This confluence of events may be playing out in other industries and be part of why the Fed considers rising key consumer and producer prices transitory and not permanent. Nonetheless, inflationary concerns that recently unnerved the capital markets will likely continue to arise for some time to come. [chart courtesy Bloomberg LP © 2021]

WCM Chart of the Week for December 7, 2020

This week we are in the midst of examining the likelihood of a pandemic-induced housing crisis and its effects on families, the economy, and markets.  As we learned during the Financial Crisis, it is a very slow process to foreclose on a mortgagee and remove them from a home, particularly when there is a massive backlog of borrowers in similar circumstances. Renters, on the other hand, are more immediately vulnerable to eviction and subsequent homelessness. This week’s chart from econofact.org illustrates the percentage of households suffering a moderate or extreme cost-burden of rent (30% to 50% of income) by household income tier. These observations are pre-COVID, so we can reasonably expect this picture to be much worse in 2020. Government-issued moratoria on evictions kept people in their homes but also shifted the economic burden to the literal doorstep of landlords, many of whom are small businesses. As those edicts roll off but the pandemic still rages in the coming months, landlords will of necessity pursue their economic and business interests and housing insecurity will jump. Whether it is on the backs of the landlords or the renters, the social and economic consequences of this income and housing crisis will play out in our communities, in the real economy and in the investment markets for some time to come.