“It’s really important that people begin to understand and have transparency when making purchasing decisions as consumers… what high-risk businesses are. When you are paying X, Y, or Z for a shirt or an outfit, there are people sacrificing their lives to bring it to that cost level.” (Bongiovanni, WCM ESG Week, 2021). In 2016, an estimated 40.3 million people were living in some form of modern slavery, whether through sex or labor trafficking or domestic servitude. Although declared illegal in almost every country, human trafficking or modern slavery persists at deplorable rates, even within developed nations like the United States. No community is immune, and no age, race, gender, or nationality is exempt from being exploited. Traffickers often use violence, manipulation, or false promises of high-paying jobs or romantic relationships to entice victims into trafficking situations. They target vulnerable individuals who may be experiencing economic hardship or emotional or psychological distress, or who may live in areas of natural disaster, political instability, or civil unrest (Homeland Security, 2020). In the United States alone, the FBI estimates over 100,000 children are victims of sex trafficking. Children in the foster care and welfare system are particularly vulnerable due to a lack of family support and stability. 60% of child sex trafficking victims recovered through FBI raids in 2013 were found to be on record in the foster care or group home systems (NFYI, 2015). But, our youth are not the only individuals at risk.
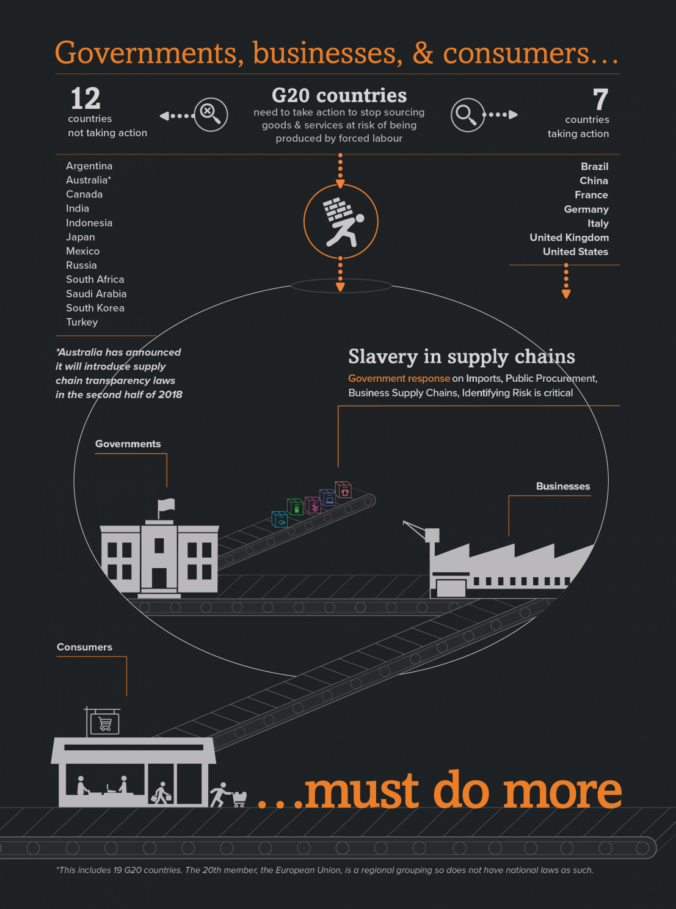
Globally, 46% of human trafficking victims are adult females, 19% young girls, 20% adult males, and 15% young boys. Human trafficking can take on many forms including forced marriages, prostitution, and domestic servitude. Trafficking even infiltrates private and public supply chains through forced labor and debt bondage, many within the sectors of construction, manufacturing, agriculture, mining, fishing, and forestry. Collectively, G20 countries (the intergovernmental forum comprising 19 countries and the European Union aimed at addressing major global issues) are responsible for importing $354 billion worth of at-risk products each year. The top products, by each country according to US dollar value include apparel and clothing accessories, sugar cane, coal, fish, timber, and laptops, computers, and mobile phones. Disappointingly, only seven G20 countries have formally enacted laws, policies, or practices to halt business and government sourcing goods and services produced by forced labor (Global Overview, 2020).
So, what can we do as consumers and investors to ensure that we do not contribute to or support the exploitation of “human capital”? “One of the most important first steps to addressing the problem is discovery and disclosure. Transparency will assist a variety of stakeholders, from customers and business partners to investors and lenders, to make more intelligent decisions about deploying capital. The end goal is to change how companies build those supply chains and wring slavery out of the system” (Sloss, 2019). Tune into our podcast WCM ESG Week Day 4: The Business of Human Trafficking with Michele Bongiovanni of HealRWorld and Distributed Data Network as we discuss the issue of human trafficking, its widespread and fundamentally objectionable consequences, its interwovenness in the Developed West, and what actions are being taken to weed out and eliminate trafficking within our supply chains.
https://nfyi.org/issues/sex-trafficking/
https://www.dhs.gov/blue-campaign/what-human-trafficking
https://www.unodc.org/unodc/en/data-and-analysis/glotip.html