Page 4 of 28

WCM image of the week for September 21, 2021

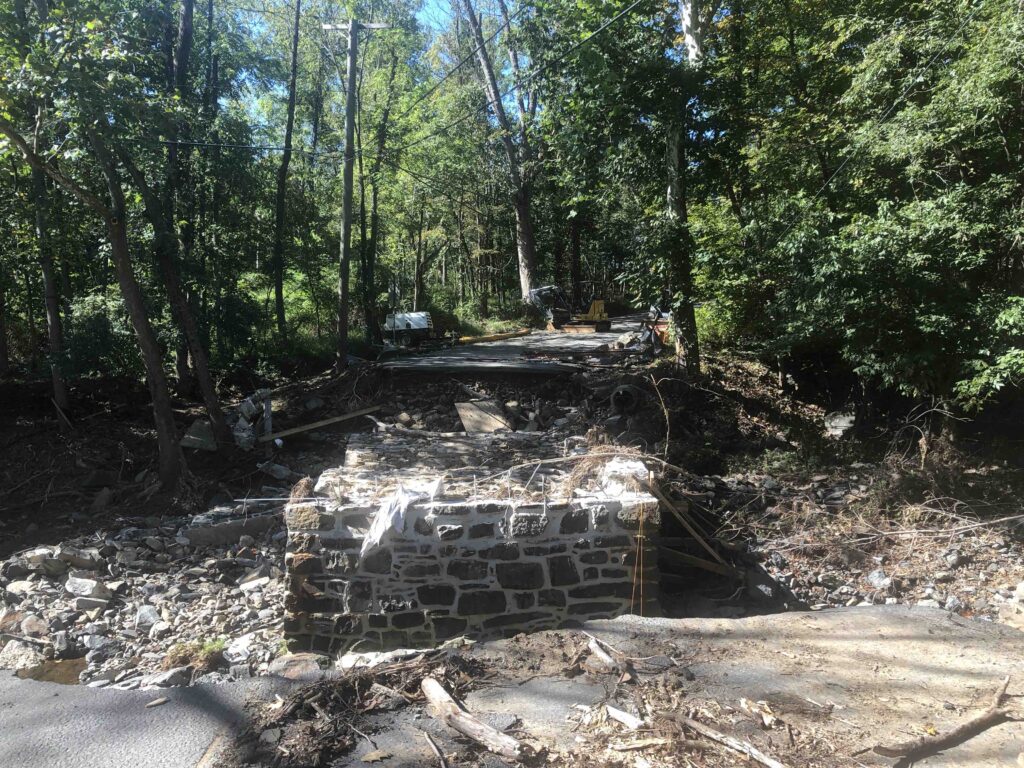
Climate change imposes an indiscriminate tax on everyone. Increasing fire, flood, tornadoes, hurricanes, and coastal inundation are destroying private property and public infrastructure at an ever-increasing rate. But, there is no “they” to pay for it. We are they. And, it is not just the damage to places and things. There is a human cost in terms of lives and livelihoods, but also in the labor of countless emergency service workers, utility workers, etc. who go to work when a blaze needs to be battled or families need to be rescued from the roofs of their homes. People who do the brave work do not come cost-free. Even if they are volunteers they need resources to do their jobs. Looking locally, capital is being consumed in the tens, perhaps hundreds of billions of dollars here in the US not to create the next bridge, highway, dam or sewer, but to repair or replace what was already there. The cost of adaptation and resilience to climate change will accelerate away from us as well if the trajectory of change continues as it has. There is no path to higher global temperatures that does not include a tremendous economic burden falling on the backs of the global citizenry. We can pay the tax when the bill comes due, or we can seek out more capital-efficient ways to mitigate climate change and climate risk before it gets worse, including pricing that risk properly in the capital markets.

WCM Chart of the Week for September 13, 2021

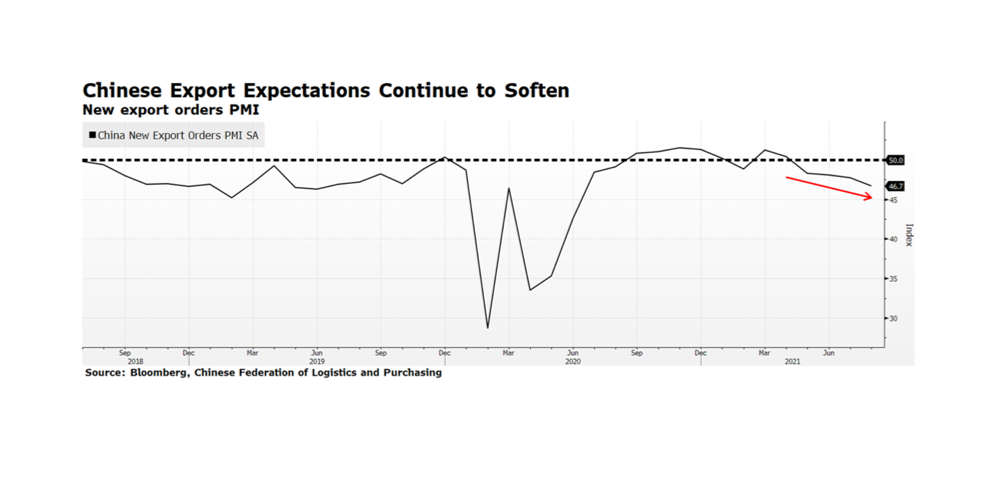
We are back, but maybe China is not. China’s purchasing manager index for exports has signaled a decline since April’s reading of 50.4 (a reading below 50 suggests a deterioration in conditions). This data series is interesting in the current inflation debate because it is a barometer of global trade and aggregate demand. If demand is weakening while headline consumer and industrial prices remain elevated, that suggests that the supply/demand balance is being dominated by supply-related issues. This could make sense given the numerous instances of supply chain bottlenecks, transportation issues, etc. that we have discussed and that continue to make headlines. Consequence for the markets — this may be another reason why the Fed may be dovish for longer. [chart courtesy Bloomberg LP (c) 2021]

WCM Chart of the Week — Summer-End 2021

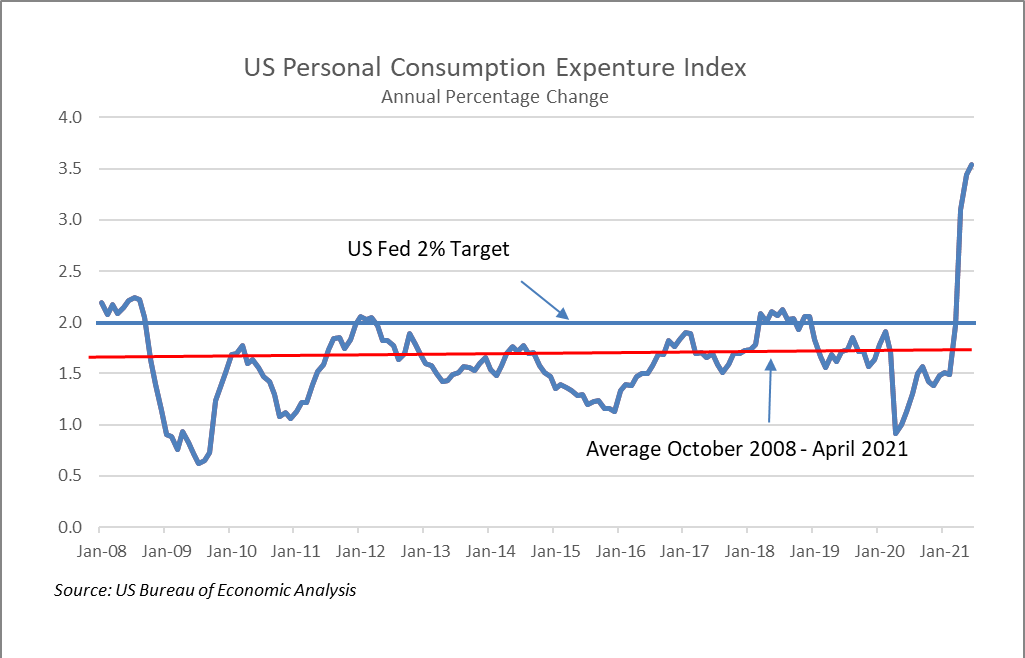
This will be our last chart before Labor Day. The US Federal Reserve’s preferred measure of inflation, the YoY rate of change in the Personal Consumption Expenditure Index (PCE), has been exceeding its 2% target rate since April making investors concerned that we may be approaching a monetary tightening cycle. That fear was escalated by this week’s release of the Fed’s July 28-29th meeting minutes that indicated they may begin to wind down the current $120 billion monthly asset purchases by the end of this year or the beginning of 2022. The Fed has expressed its view that current inflation trends are transitory and are likely due to temporary factors such as supply chain bottlenecks and a strong rebound in demand from last year’s lull in consumption. As of June 30th, the current annual rate of the PCE was 3.54%, well above the Fed’s target, but in June 2020 the reading was 1.13%. Since the Fall of 2008 during the Financial Crisis, the PCE has been stubbornly below 2%, averaging 1.59%. Over that period of nearly 13 years, the PCE has been over 2% only in Q1 2012 and for most of 2018.  Inflation has been undershooting for a long period leaving aggregate price levels far below the Fed’s ideal. This suggests to us that the Fed will likely tolerate inflation until the PCE normalizes.

WCM Chart of the Week for August 18, 2021

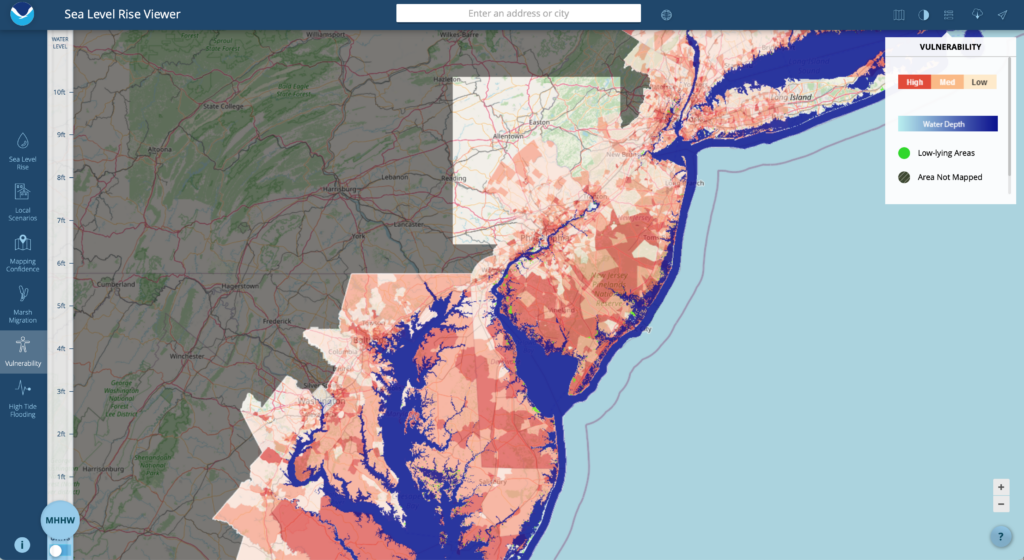
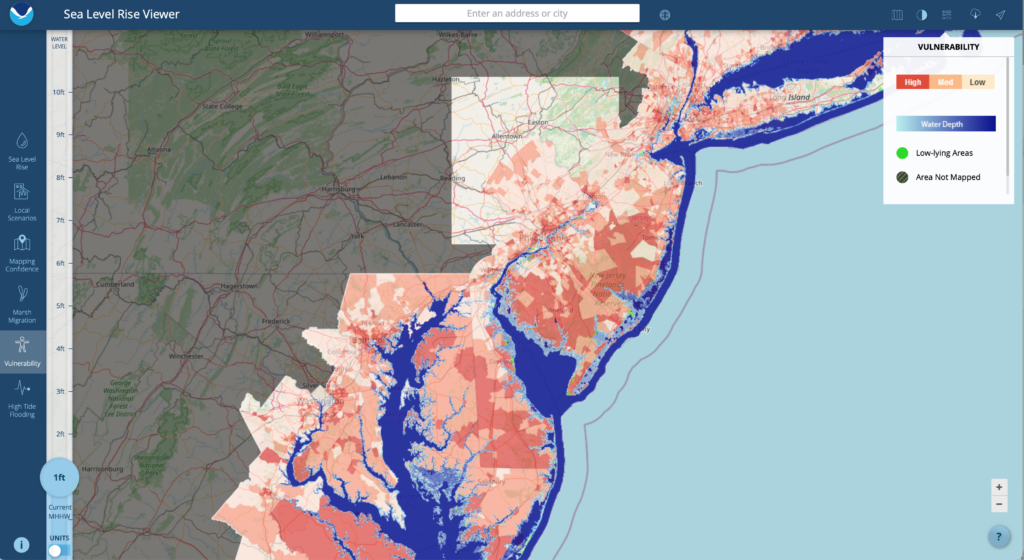
The Intergovernmental Panel on Climate Change (IPCC) released the Working Group I contribution to the Sixth Assessment Report which will arrive fully in 2022. Among the reaffirmed findings in the report is that we are already most of the way to the 1.5 degree Celsius threshold over pre-industrial global temperatures where climate-related damage becomes more widespread and harder to turn back. We wanted to examine what that means in practical human terms. According to NOAA (R. Lindsey, Jan. 25, 2021), we have seen 8 – 9 inches of sea level rise since 1880, and in some ocean basins nearly that much just since the beginning of the satellite record. Taking the IPCC findings into account and with NOAA’s own models, sea level could rise another foot over 2000 levels by the end of the century. The two images provided are from NOAA’s Sea Level Rise Viewer. The first is a view of the heart of the Northeast Corridor from Long Island Sound down to the Chesapeake at the current “Mean Higher High Water”. The principal shading illustrates the population vulnerability to sea level rise. The second is the same view under a 1 foot MHHW scenario. Note the amount of coastal inundation, particularly around high density and vulnerable populations. The amount of property and population at risk in human and dollar terms is staggering in this relatively concentrated area, and has implications for municipalities, commercial real estate, infrastructure, corporations, maritime interests, tourism, and residential neighborhoods, and all the supply chains and institutions elsewhere like banks and insurance companies that are exposed to that risk. Smart investing requires thinking about mitigation, resiliency, and adaptation, hallmarks of ESG investing and increasingly becoming part of mainstream investing.

WCM Chart of the Week for August 9, 2021

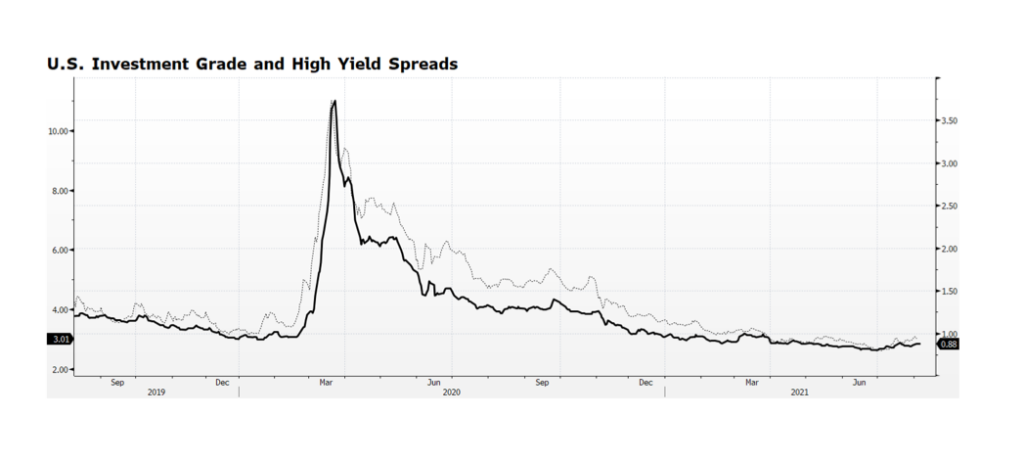
Investment Grade and High Yield bond spreads have been edging higher since reaching their tightest levels ever at the end of last quarter. Admittedly, the spread widening may have more to do with the decline in Treasury yields since June 30th than an indication of any deterioration in the credit markets. What is interesting to us is that this has been occurring while broad stock market indices in the US and Europe are hitting all-time highs. Equity market valuations are full, particularly in the US, but according to Bloomberg consensus earnings are expected to grow by 11.8% over the next 12 months, putting the forward PE ratio of the S&P 500 at 20.3x, lofty yet not extreme. Our sense is that, barring a major surprise or a misstep by the US Fed, the positive tone in equities in the Western world will continue. The outcome of the Fed’s September meeting will be highly scrutinized but the likelihood that they will surprise markets is low. [chart courtesy Bloomberg LP © 2021]

WCM Bonus Chart for July 23, 2021

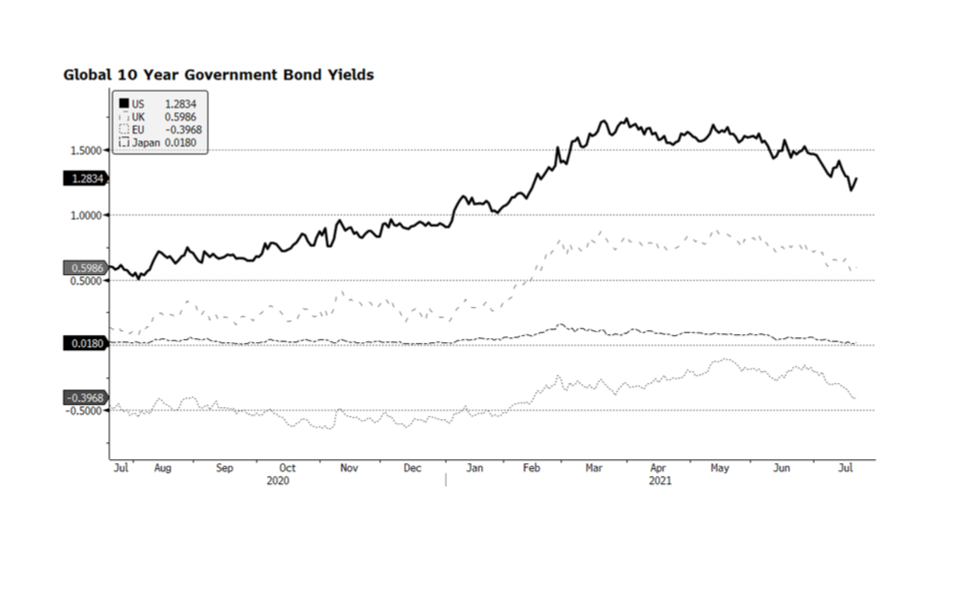
Because we took a hiatus for the holidays, we have extra thoughts to share. The US Bureau of Labor reported that consumer and producer prices came in higher than the consensus last week and that may have been part of the reason why stocks retreated. We view the consolidation in US stocks as healthy at this point, especially considering strong corporate earnings momentum and analysts increasing their earnings forecasts rather than the opposite, which oftentimes occurs at this point in the year. Forecasters usually have a difficult job but given the condition of the world during the pandemic and the incongruent economic recovery so far, it makes now even more challenging. Global bond markets are suggesting a different read on inflation and the near-term outlook for monetary policy, both benign for risk assets. The benchmark 10-year US Treasury bond yield continues its decent after the near-term peak of 1.74% on March 31st and now at 1.28%. Interestingly, government bond yields in the developed world have also fallen with equivalent US interest rates suggesting that current inflation readings are more of a temporary condition rather than a long-term concern. Disinflationary trends are starting to emerge including declining commodity prices, benign capacity utilization rates and strong productivity levels. If bond yields were trending higher along with stronger inflation readings we would be more concerned about risk assets. [chart courtesy Bloomberg LP © 2021]

WCM Chart of the Week for July 20, 2021

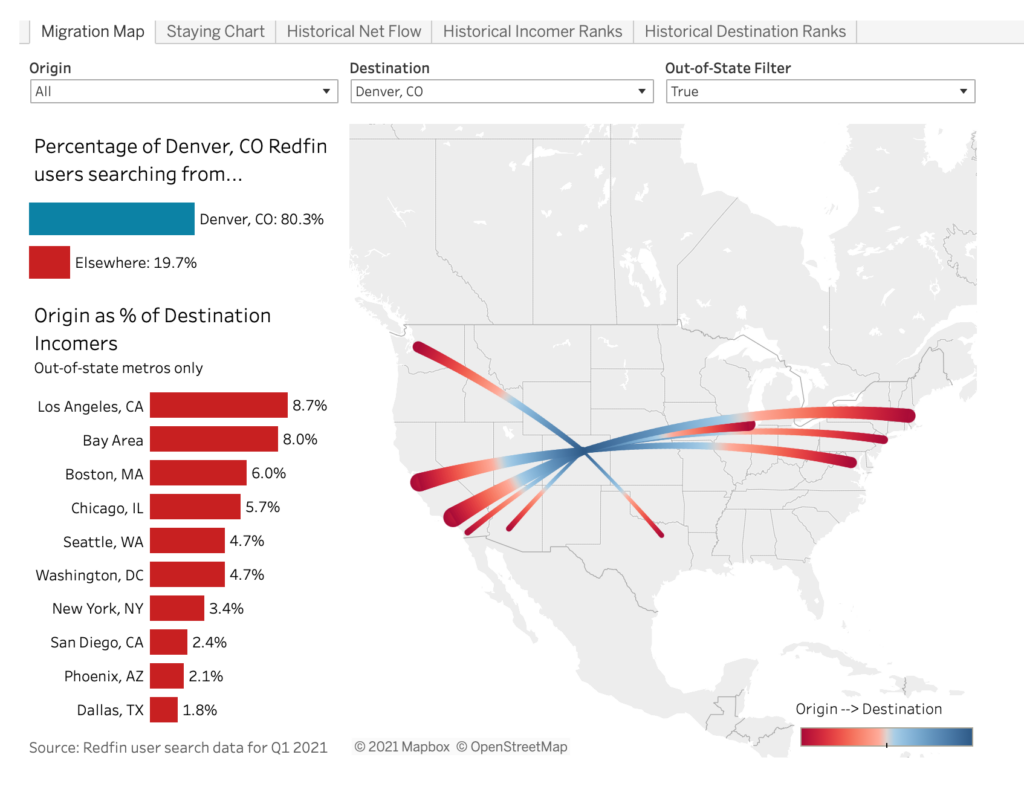
And we’re back. Everyone here is hoping everyone out there has taken some time to breathe a little of the relatively COVID-free air and begin to think about what a return to (the new) normal looks like. In that spirit, this week’s chart is from data provided by Redfin, a national real estate brokerage, on Q1 2021 relocation searches. One of the consequential impacts of COVID and the shutdown was an acceleration of outward migration from major urban centers. We are at a point in the generational cycle where it was to be expected with Millennials anyway, but the urgency was ramped up considerably. With companies reimagining what a workforce and a workplace look like, many people with knowledge economy jobs are able to quite literally work from anywhere. Residential real estate in less urban, less expensive and more desirable areas like Denver, CO (this week’s chart) have seen a crush of interest from urban economic centers and a rapid rise in prices as a result. We envision some of this will reverse, but much of the population movement is likely permanent, changing the economics of numerous communities across the country.

WCM Chart of the Week for June 28, 2021

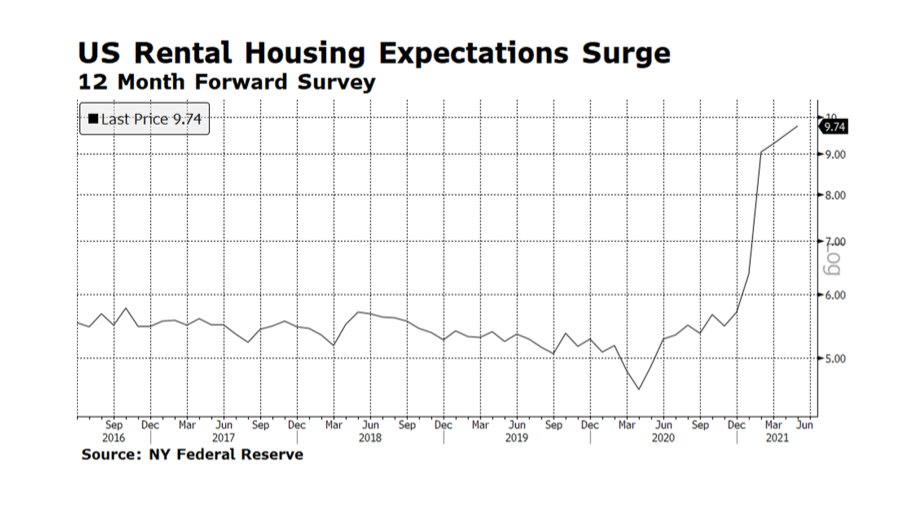
Since 2013, the NY Federal Reserve has been conducting a consumer survey focused on expectations for rental housing costs in the year ahead. The survey participants expect housing rental costs to soar a record 9.7% in the next 12 months, which is a major increase from the average of about 5.6% since the survey began nearly eight years ago. Survey data and other “soft” indicators, while useful, tend to lag hard data. Granted, there are also widespread reports of labor shortages and lack of transportation, but that is most likely a temporary condition. Taking this and other signals into account, we would be more concerned about inflation becoming a more permanent problem if the bond market was behaving as if the economy was moving towards that. But, the benchmark 10-year US Treasury bond yield, now standing at 1.47%, has descended from its peak of 1.74% on March 31st. Also, some key commodity prices are declining — the lumber crack spread (cited by WCM on June 14th) has fallen over 30% in two weeks. For now, we view these pockets of inflation as more of an adjustment from pandemic-created economic readings rather than a permanent progression towards higher consumer price levels. [chart courtesy NY Fed and Bloomberg LP © 2021]

WCM Chart of the Week for June 22, 2021

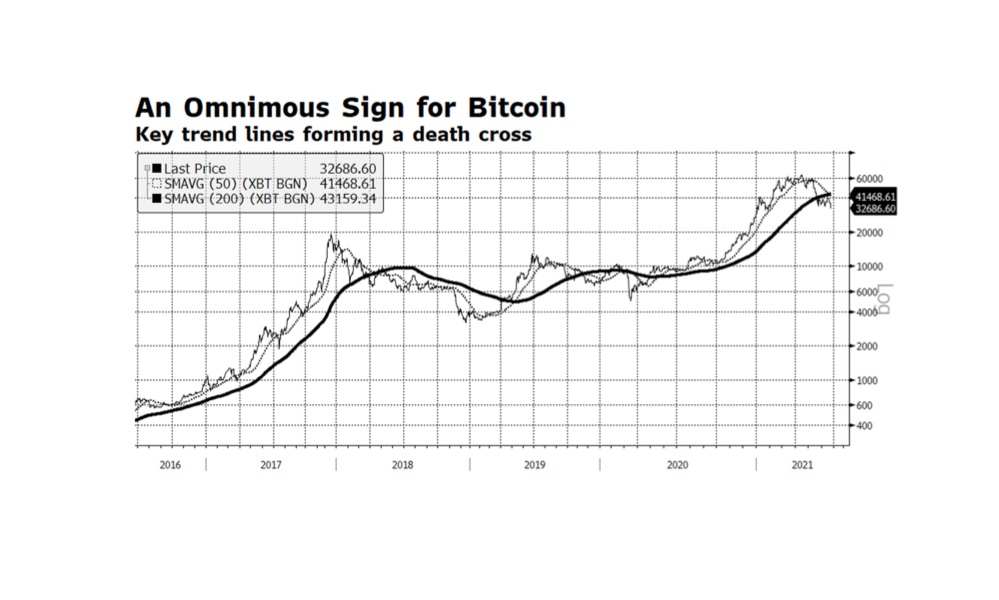
Those participating in the frenzy in crypto-related investing may be in for some more downside pain in the months ahead as a bellwether, Bitcoin, has formed the notorious “death cross”, which is when the 50-day moving average falls below the 200-day. So far it is approaching nearly a 50% drop since its peak in mid-April. Technical analysis may be more useful in evaluating the merit of such investments that have no or little fundamental data on which to base a decision. Part of the rationale for investors to acquire positions in Bitcoin and other related investments lies in the idea of using them as a means of exchange and potentially as a store of value. The latter dimension has been gaining credibility as major central banks continue to pursue aggressive quantitative easing, effectively debasing their currencies to one degree or another. We cannot divine where the trend in cryto investing is headed in the intermediate term, but there is no denying that interest is growing. If recent history is any guide, investors who chose to hold these investments need to be prepared for further losses. The previous two times when death crosses were formed in 2018 and late 2019, losses surpassed 64% and 30%. Not for the faint of heart. [chart courtesy Bloomberg LP (c) 2021]

WCM ESG Week — Theme 5: Climate Justice

Climate change has pervasive and profound consequences for our planet, economies, and cultures. The systems of climate do not discriminate across racial lines, income levels, or geographical locations, nor abide by governmental policies and regulations. But it is important to draw a distinction between the worsening storms, sea level rise, drought, fire, ice loss and mass extinctions that occur on a planetary level, and the injustice of more prosperous businesses, communities, and nations driving that climate change and imperiling already marginalized communities at home and abroad. We lay witness to social, economic, public health, and environmental effects disproportionately impacting vulnerable and underprivileged populations. We acknowledge these inequalities of influence, largely on minority and low-income communities, as climate or environmental (in)justice.

Continued increases in global warming contribute to already existing challenges in eradicating poverty, reducing inequalities, and ensuring healthy individuals and ecosystems due to higher food insecurity and reduced water supply, community income losses, lost livelihood opportunities, adverse health impacts and population displacements, and increased competition for arable land. Poverty and disadvantage are projected to rise in some populations due to increased global warming. Some of the most severe impacts of climate change and a lack of climate resiliency are expected to be felt among agricultural and coastal dependent regions, indigenous people, children and the elderly, poor laborers and urban dwellers in African cities, and people and ecosystems in the Arctic and Small Island Developing States (SIDS), dryland regions, and least developed countries (IPCC, 2018).

For example, land degradation refers to the deterioration of soil quality due to both natural and anthropic impacts, accelerated during the 20th and 21st centuries as a result of increasing agricultural and livestock production, urbanization, deforestation, and extreme weather events such as droughts and coastal surges. Land degradation occurs over 25 percent of the Earth’s ice-free land area, affecting 1.3 to 3.2 billion people, the majority of whom are living in poverty in developing countries (IPCC). Land degradation and climate change, both independently and in conjunction, have severe consequences for natural resource-based regions including higher threats of malnutrition, increased risk of water and food borne diseases resulting from poor hygiene and lack of clean water, increased respiratory diseases due to atmospheric dust from wind erosion and air pollutants, and spread of infectious diseases as communities experience lack of food production and are forced to migrate to more hospitable regions (WHO, 2020).

Furthermore, increasing global warming intensifies the exposure of small islands, low-lying coastal areas, and deltas to the hazards related to rising sea levels including increased saltwater intrusion, flooding and damage to infrastructure, loss of coastal resources, and a reduction in the productivity of fisheries and aquaculture. One global fishery model projected a decrease in global annual catch for marine fisheries of about 1.5 million tonnes for 1.5°C of global warming, with a loss of more than 3 million tonnes for 2°C of global warming. The risk of irreversible loss of many marine and coastal ecosystems escalates with global warming, specifically coral reefs which are projected to decline by a further 70–90% at 1.5°C and larger losses (>99%) at 2°C warming. Furthermore, changing ocean biochemistry due to increased acidification adversely affects marine species’ physiology, survivorship, habitat, reproduction, and disease incidence, and increases the risk of invasive species. Risks from vector-borne diseases, such as malaria and dengue fever, are projected to increase with warming in addition to potential shifts in their geographic range (IPCC, 2018).

In addition to global warming and changing ecosystems, global industries also contribute to environmental injustice. Oil exploration and drilling fields have produced severe impacts on indigenous peoples and vulnerable communities around the world who depend on healthy ecosystems to survive. Oil drilling in the Amazon basin spurs deforestation of the land, introduces toxic pollutants impacting indigenous peoples’ health and wellness, and allows for hazardous working conditions for local employees. Incursions into indigenous lands are frequent and have been recorded in more than 20 communities in at least 10 countries including the United States, Australia, Bolivia, Brazil, Ecuador, and Peru (UN, 2021).

Closer to home, labor groups in Louisiana have reported dangerous working conditions in oil refineries, as they emit numerous types of toxic chemicals including benzene, formaldehyde, hydrogen sulfide, sulfur dioxide, and sulfuric acid. Oil production companies, although permitted to release these chemicals to the environment in designated amounts, are plagued with accidental spills and leaks often exceeding the allowable volumes. This toxic contamination puts nearby communities at high risk of environmental health problems. Additionally, in regions where fracking is used as a method to extract shale gas, such as Pennsylvania, surface and well waters are continually contaminated with the toxic chemicals used in fracking fluids and petrochemical run-off including salts, heavy metals, and radioactive chemicals. Oil pollution contaminates both drinking and agricultural water supplies for livestock and irrigation, which has been found to be particularly detrimental in the Melut Basin of South Sudan in Africa (UN, 2021).

Oil refineries and other chemical releasing facilities are predominantly surrounded by minority populations. Communities located in close proximity to such facilities, coined “fenceline communities”, are exposed to various kinds of toxic pollution, and in the U.S. are disproportionately composed of African Americans, Latinos, and low-income groups. The highest concentration of U.S. oil refineries is located in the Gulf of Mexico, with one of the most notable fenceline communities residing outside Houston, Texas. Three quarters of the city’s residents live within three miles of the 191 hazardous chemical facilities and are known to be at higher risk for heart disease, cancer, and respiratory problems related to poor air quality, such as asthma and emphysema. The combination of lack of access to healthy food, high poverty rates, and increased exposure to deadly contaminants makes for a serious problem in fenceline vulnerable communities, especially African Americans. Fenceline communities are found in many states across the U.S. as well as globally (UN, 2021).

We have also observed a trebling effect with fenceline and other economically disadvantaged communities when climate change and environmental pollution collide. Storm surge, inundation, flood, and wind often cause this pollution to breach containment and further toxify neighborhoods and cities, waterways and water supplies, and farmable land as with Hurricane Katrina in 2005in Louisiana and Harvey and Imelda in 2017 and 2019 in Houston, TX. These types of climate-related disruptions cause communities to fracture as vulnerable people move to seek cleaner, safer, healthier, more sustaining situations. This destabilization can lead to diasporas, conflict and even war, as well as the disintegration of cultures and art. From port cities to open grasslands to the frozen tundra, the ability to be resilient and adaptive in the face of these environmental and climate forces requires access to capital and opportunity. Even better, developed economies taking their collective foot off the literal and figurative gas pedal will help to manage down the risk and give these at-risk communities a shot at better outcomes. Climate justice involves doing both. Less extractive and more regenerative. Systems that work on a global level for the benefit and welfare of all.

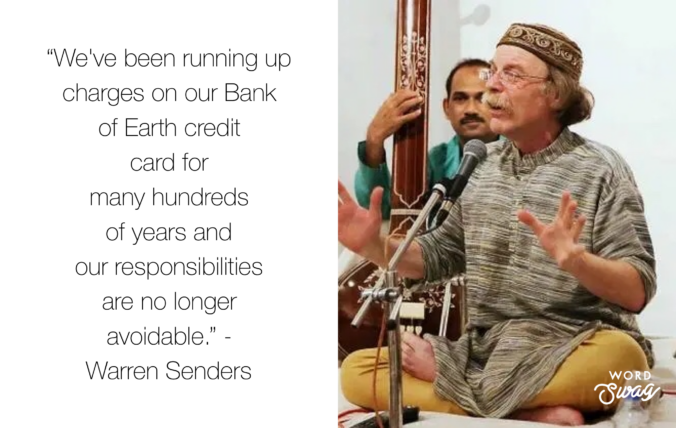
Climate justice gives us the words and concepts to frame and then address countless intertwined challenges that affect access to nutrition, access to clean water, access to education, access to economic opportunity, an expectation of peace and prosperity, and the ability and in fact the right to care for our collective legacy and culture and gift it to the generations that come after. Our final discussion for ESG Week is with Professor Warren Senders of the New England Conservatory of Music. We explore the interconnectedness of climate science, indigenous wisdom, and world art and culture, and our collective responsibility to care for the planet we have, and to care equitably and justly for the people on it.

https://www.who.int/news-room/q-a-detail/climate-change-land-degradation-and-desertification

https://www.ipcc.ch/site/assets/uploads/sites/2/2019/06/SR15_Full_Report_High_Res.pdf

https://wedocs.unep.org/xmlui/bitstream/handle/20.500.11822/35417/EJIPP.pdf
« Older posts Newer posts »