Category: Currency (Page 1 of 2)

WCM Chart of the Week for November 29, 2021

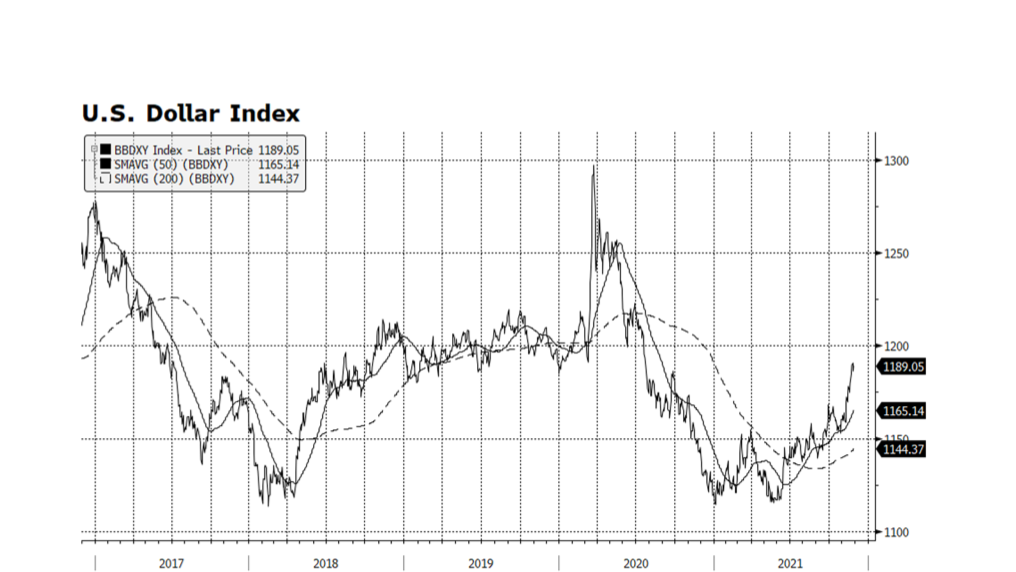
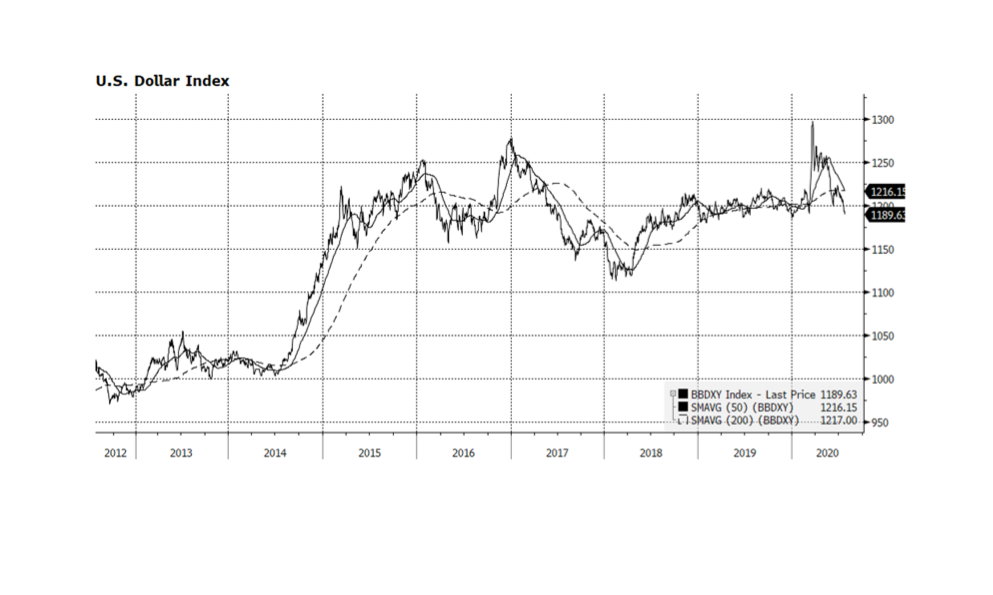
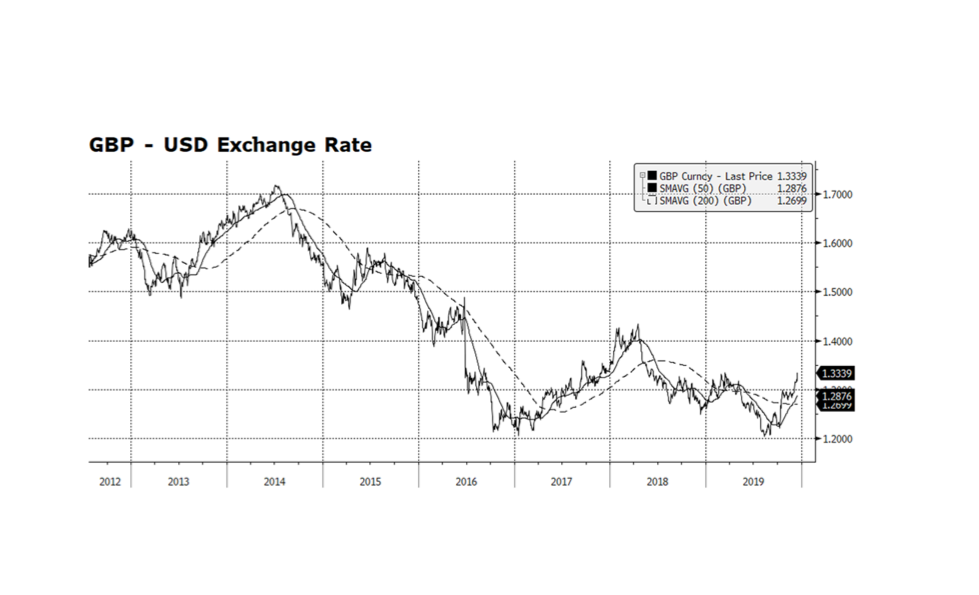
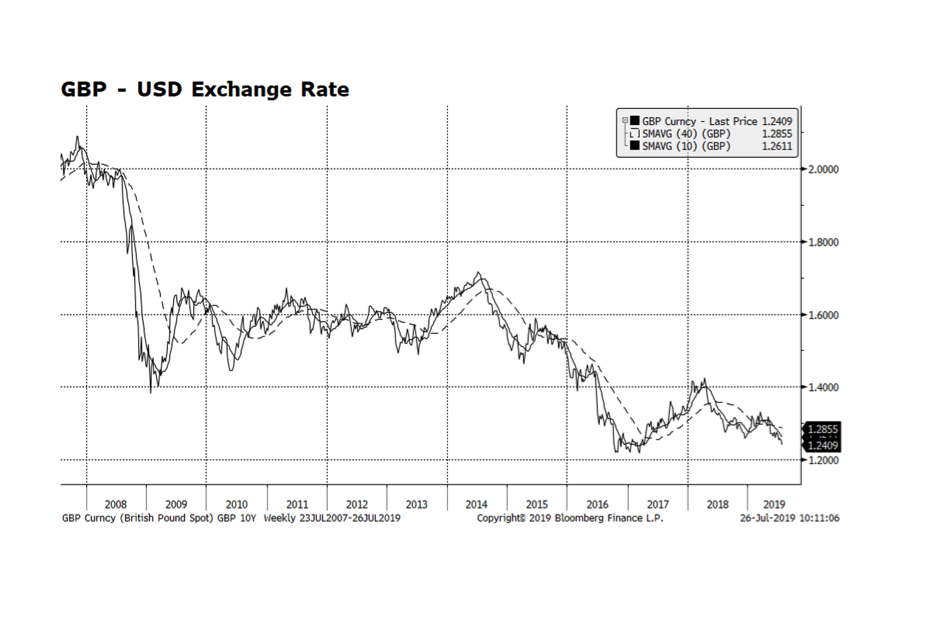
Consumer prices in the US are observably on the rise across a broad array of products and services. The Federal Reserve’s preferred inflation gauge, the PCE, last week registered a 4.1% annual increase, well above the Fed’s target. The causes of higher prices are well known, ranging from supply chain bottlenecks to raw material scarcity to higher energy costs to a shortage of transportation personnel. Adding to the inflationary mix is strength in the US dollar which has recovered over 6% according to the Bloomberg US Dollar index, comprised of a basket of major currencies. The dollar has recovered to pre-pandemic levels and could strengthen further as the Fed begins to reign in liquidity towards the end of 2022 if not earlier. Continued dollar strength could provide some inflationary relief in the form of lower import prices and could be justified given strong US economic growth and the interest rate differential between the US bonds and the rest of the world. As this week’s chart illustrates though, currency movements are notoriously difficult to predict. [chart courtesy Bloomberg LP © 2021]

WCM Chart of the Week for June 22, 2021

Those participating in the frenzy in crypto-related investing may be in for some more downside pain in the months ahead as a bellwether, Bitcoin, has formed the notorious “death cross”, which is when the 50-day moving average falls below the 200-day. So far it is approaching nearly a 50% drop since its peak in mid-April. Technical analysis may be more useful in evaluating the merit of such investments that have no or little fundamental data on which to base a decision. Part of the rationale for investors to acquire positions in Bitcoin and other related investments lies in the idea of using them as a means of exchange and potentially as a store of value. The latter dimension has been gaining credibility as major central banks continue to pursue aggressive quantitative easing, effectively debasing their currencies to one degree or another. We cannot divine where the trend in cryto investing is headed in the intermediate term, but there is no denying that interest is growing. If recent history is any guide, investors who chose to hold these investments need to be prepared for further losses. The previous two times when death crosses were formed in 2018 and late 2019, losses surpassed 64% and 30%. Not for the faint of heart. [chart courtesy Bloomberg LP (c) 2021]

WCM Chart of the Week for May 25, 2021

The US Fed and European Central Bank (ECB) continue to pursue aggressive quantitative easing while the two dominant Asian central banks, the Bank of Japan and the People’s Bank of China, have slowed their securities purchases so far this year. The ECB’s activity is of particular interest, not only because of the size of the balance sheet ($9.2T, €7.6T), but the pace that it has expanded over the course of the past year. The ECB’s monetary support continues at a critical time as the EU economy appears to be emerging from the pandemic-induced slump. Lock downs are slowly being lifted and infection rates are plunging from the March and April spikes. Another promising (gradual) trend emerging is in sovereign interest rates in the region, which appears to be an indication of stronger economic activity in the months ahead. [chart courtesy Bloomberg LP (c) 2021]

WCM Chart of the Week for December 21, 2020

European equities have been rallying yet continue to lag the US and the rest of the world. Since global equities found their pandemic-induced bottom on March 23rd, both the S&P 500 and the MSCI World Indices have rallied over 65% as of last week’s closing levels (12/18/2020) while European shares have climbed just over 60% measured in US dollar terms. While a 60% recovery in approximately three quarters is impressive, it is masked due to currency movement over the period. The Eurostoxx 600 itself has climbed 44% in local currency terms from March 23rd through Friday’s close, and the Euro has rallied over 17% since March 23rd. The disparity in performance suggests a few things to us. First, European investors may have less confidence in their stock markets due to a lack of forceful coordinated continental response to the pandemic. Second, the currency tailwinds for European shares reflect more of a “retreat” from the pandemic flight-to-safe-haven currencies like the Dollar than true economic resiliency. Finally, we are particularly mindful that other stock markets beyond Europe may offer superior growth prospects, which would be especially attractive in a low-growth developed West.

WCM Chart of the Week for October 5, 2020

Over the past several weeks, credit spreads in US Investment Grade and High Yield bonds have risen while US equity prices hover near key support levels established since the S&P 500 and Nasdaq Composite indexes posted record highs in early September. Some consolidation in equities can be justified given the rapid recovery from the pandemic-induced lows reached in late March. The bond market appears to be sensing heightened risk. Credit spreads fell a considerable amount since the late-March spike but remain elevated compared to pre-pandemic levels and are on the rise even considering the modest tightening this past week. The yield on the 10-year US Treasury has been relatively stable since the beginning of September, fluctuating 5-10 basis points, and the US Federal Reserve remains in hyper-accommodative mode implying that the rising price of money for US corporate creditors is the main driver of widening spreads. This trend suggests that there may be further volatility ahead for US corporate securities. [chart courtesy Bloomberg LP (c) 2020]

Updates to our monthly newsletter format

WCM has made some changes to our monthly newsletter to make it more engaging and useful for our readers. First, we have moved our interpretive analysis of the month gone by to the front and expanded it. We follow that with our current portfolio positioning and what we see as the capstone risks to our stance. Lastly, we close with a performance survey of capital markets for the prior month, calling out what we see as the most consequential returns which played into both our thinking and our results.

As always, you can find our latest newsletter in the Library, along with an archive of prior newsletters. Thank you for reading!

WCM Chart of the Week for July 24, 2020

The US dollar’s dominance versus the world’s leading currencies may be nearing its end, at least cyclically. Bloomberg’s US Dollar Spot index is essentially flat year-to-date and has given up all its COVID-19 flight-to-safety gains. Since March 20th, the index is down over 8%, driven by gains in the Euro and British Pound. This could be an indication that conditions in the rest of the world are improving, a welcome sign if indeed it proves to be true. One key development in our view, is that the European Union has agreed to a desperately needed 750 billion Euro ($857 billion) pandemic relief plan that is being financed collectively for the first time in history rather than by individual nations. The relief will be targeted at nations hit the hardest and will take the form of grants that will not have to be repaid. This is noteworthy because, for decades, richer northern European nations resisted aiding economically challenged countries during times of duress. This event could prove to be a watershed moment that could lead to a stronger European Union economically and politically and that would be good for the world. [chart courtesy Bloomberg LP © 2020]

WCM Chart of the Week for May 29, 2020

The Bloomberg Barclays Aggregate Bond Indices are widely considered to be the global standard for fixed income gauges. This week we compare the US Aggregate vs. the International Unhedged Aggregate. Over the long-term (12 years shown below) US bonds have outperformed significantly overall, with only brief bouts of underperformance in the short term. There are several reasons that explain US fixed income dominance — USD strength, interest rate spreads across comparable sectors and superior corporate fundamentals. The current phase of US leadership has persisted since early 2018 but may be showing signs of fatigue at the end of the longest period of outperformance over the past dozen years. The dollar remains elevated vs a basket of major currencies compared to pre-pandemic levels, although that appears to be normalizing in recent weeks. Our view is that, as long as comparable interest rates in other major economies remain negative, or spreads benchmarked against US interest rates remain wide, global investors will prefer US bonds. We currently hold little or no international fixed income and remain positioned in shorter duration instruments. [Charts and data courtesy Bloomberg LP © 2020]

WCM Chart of the Week for December 13, 2019

Boris Johnson’s Conservative Party triumphed in Parliamentary elections on December 12th, gaining 48 seats, which gives the party a clear majority in the House of Commons.  Support was surprisingly strong in Northern England and Wales which have been historically been Labour Party strongholds.  The outcome all but makes Brexit a certainty and Johnson has indicated that he will accelerate legislation through parliament to meet the January 31 target date for leaving the EU.  The Great British Pound (pictured below) as well as the UK stock market rallied strongly, likely in anticipation of the electoral outcome.  British assets have been trading at significantly lower valuations than comparable global assets and this may be a catalyst that brings values more in line.  In our view, there still is uncertainty regarding potential disruption in supply chains and labor markets as the Brexit process unfolds.  There is, however, more clarity regarding this tense situation. [chart courtesy Bloomberg LP © 2019]

WCM Chart of the Week for July 26, 2019

It was worth waiting a couple days to post our chart to see how markets would handicap the new occupant of 10 Downing Street. The British Pound, currently trading at 1.24 US Dollars, is approaching the lows reached after the Brexit referendum vote of June 23, 2016.  Britain’s formal deadline to exit from the European Union has been extended to October 31, 2019, and with the newly appointed Prime Minister Boris Johnson that deadline could turn out to be firmer than it was perceived to be under May.  If Johnson pushes through with a “hard” Brexit, it would likely lead to trade and supply chain disruption, uncertainty regarding the residency status of both UK and EU citizens, and the potential return of a physical border in Northern Ireland.  The potential fallout is another headwind facing the struggling UK and EU economies.  Given all this uncertainty we would not be surprised to see the Pound head to even lower levels.

« Older posts