Author: WCM (Page 3 of 9)

WCM Chart of the Moment

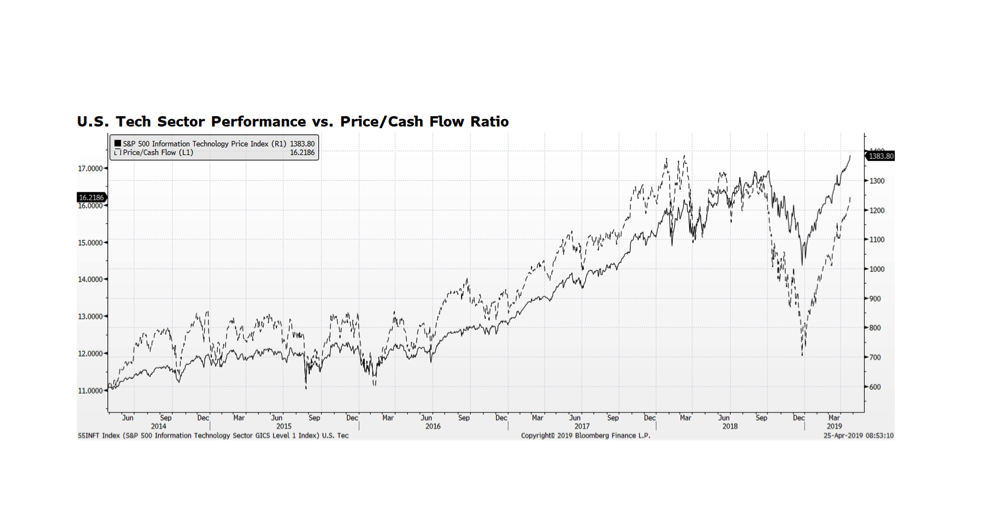
A little off-schedule so we’ll call it the Chart of the Moment. Based on Standard & Poor’s indices, the rebound in US technology stocks since the beginning of the year is an impressive 27.8% while the overall equity market has advanced 17.5% through April 24th.  US technology companies play a critical role in the American economy and the sector is the largest in the US equity market based on capitalization. Further gains of US equities overall largely depend on tech sector performance and valuation readings are approaching historically high levels. We show the technology sector along with its price-to-cash flow (P/CF) valuation metric.  The current P/CF is 16.2 which is below last March’s five-year high of 17.6 but still in an area where the sector has struggled.  We are currently in the midst of the US earnings season, and if technology companies can continue to deliver strong earnings and cash flow, share prices should advance further. (all data citations as of April 24, 2019)

WCM Chart of the Week for April 17, 2019

The Eurozone has faced several roadblocks to growth since the Financial Crisis ranging from the debt crises in Italy and Greece, to the uncertainty related to Brexit to stubbornly sluggish economic growth.  We have been concerned that economic conditions on the Continent would strain corporate performance and therefore we have not been fully committed to Eurozone equities for quite some time even though the region has favorable valuations compared to global peers.  Now there may be positive trends developing.  This week’s chart shows Citigroup’s Earnings Revision Indices for Continental Europe and the Globe.  The latest reading for Europe was flat while the World registered -0.12.  Both indices appear to be trending towards positive revisions which could provide a key underpinning for further gains in global equity markets.  If positive developments continue in the European corporate sector, investors may rotate funds into the region.

Chart courtesy Bloomberg LP (c) 2019

WCM Chart of the Week for April 10, 2019

We’ve been proponents of Environmental, Social and Governance (ESG) investment disciplines going back long prior to founding WCM and it is one of our key investment offerings.  A common misperception is that ESG-related investing is prone to significant underperformance due to limitations in order to achieve ESG compliance. This week’s chart shows the total return of the MSCI World ESG Leaders Index and the MSCI World Index over the past five years.  Generally, the two indexes move in a similar direction and over the five year period ending last quarter the annualized performance differential is about 0.2% in favor of the broader index, but the performance differential is not persistent. This is the most naive way to look at ESG investing, but it decisively busts the myth that there is an automatic ESG penalty.

Chart courtesy Bloomberg LP (c) 2019

WCM Chart of the Week for April 3, 2019

Purchasing Managers Indexes (PMIs) are now signaling expansion in two of the world’s largest economies as China’s reading joins the US measure in positive territory.  China’s rebound from negative territory may be an early indicator that expansionary monetary and fiscal policies are beginning to take effect. That’s welcome news.  However, the Eurozone PMI is continuing to deteriorate with disappointing results in the German and French manufacturing sectors.  The lack of pro-growth fiscal policy in the EU is still a major drag on economic vibrancy.  That said, European bourses have posted robust returns so far this year although not as strong as US counterparts.

WCM Chart of the Week for March 22, 2019

After the conclusion of US Federal Reserve’s scheduled meeting, Chairman Jerome Powell said that the Fed has reduced their planned Fed Funds rate increases to zero for the year by a unanimous 10-0 vote. Additionally, he announced that they would begin slowing the pace of balance sheet contraction beginning in June from $30 billion to $15 billion per month and end the planned shrinkage by September. These developments were received favorably by stock and bond markets because it signals that accommodative monetary policy will be supportive of asset prices. Investors have been concerned over the past several months that the Fed had adopted an overly restrictive monetary stance while economic conditions in the US were exhibiting signs of softening which could lead to recession.  This week’s chart comes to us from the Bloomberg Economics team and shows the relationship between real US GDP growth and the real Fed Funds rate along with recessions going back nearly 50 years.  The point the team makes is that, historically, the economy has yet to head into a recession with the real Fed Funds rate at current levels, and it is not until this key rate exceeds real GDP growth that a recession follows. Those occurrences are highlighted in the circles on the chart and do appear to be an early warning of recessions. We may have a fair amount of time before seeing those conditions develop.

Chart courtesy Bloomberg LP (c) 2019

WCM Chart of the Week for March 13, 2019

Since the S&P 500 bottomed on March 9, 2009 in the aftermath of the Financial Crisis, the index price has risen over three-fold and the MSCI World Index has doubled.  Disappointingly, European shares have risen only one-third of the S&P’s price gain in the same amount of time and lagged global equities considerably.  The question in our minds is whether this is a permanent condition or will European shares become competitive with other global equity markets.  European equities do offer compelling valuation measures, particularly versus the US, but the macro pressures facing the Euro region, the uncertain outcome of Brexit and the absence of fiscal policy support may limit the price appreciation of shares in the region.

WCM Chart of the Week for March 4, 2019

South Korean exports contracted over 11% over the past year marking the second consecutive month at negative levels.  Many view this economic data series as an early indicator of global trade.  South Korea is an export powerhouse with trading relationships throughout the world and region, particularly China and Japan.  What is critical in our view is how long this trend persists — the contraction in Korean trade could turn out to be intermittent, fluctuating with periods of expansion as was the case in 2012-2013, or it could signal a more prolonged contraction with recessionary conditions that occurred during several periods over the past 20 years.  Chinese economic growth will be a key factor and some see reflationary monetary policies gaining traction later this year and it appears that purchasing managers indices may be stabilizing, albeit below expansionary levels.

Source: South Korean Ministry of Trade, Industry and Energy

WCM Chart of the Week for Feb. 21, 2019

We normally don’t make too much out of indexes that are hovering around round numbers, especially a random number like 500, but for global equities this may be meaningful.  The MSCI All Country World Index is a key benchmark for global portfolio managers and over the course of the past year, the 500 level has served as both a level of support and more recently resistance.  The index just pierced the 500 mark February 18th and that could provide a psychological lift for investors.  The key will be if market leadership can broaden beyond the US stock market and carry the index even higher.  While valuations in the US are attractive, earnings growth is slowing.  The rest of the developed world does offer value, although growth is still anemic — value alone may ultimately attract investor interest.

WCM Chart of the Week for Feb. 14, 2019

There has been a lot focus over the years on economic conditions in southern Europe and in particular Italy, which is potentially headed into a painful debt crisis.  We share these concerns, but Europe’s problems reach beyond the peripheral countries.  German quarterly GDP growth has lagged the region for the past two quarters, and the best one could say is that activity in this key economic engine is getting less worse.  The German Federal Statistics Office reports flat growth for the fourth quarter versus a decline in Q3, thus narrowly avoiding a recession. Germany is the world’s third-largest exporter and it is undoubtedly facing headwinds associated with slowing global economic growth, notably in China, and uncertainty related to the US – China trade negotiations as well as the outcome of Brexit.   Germany is the largest economy in the Eurozone and this growth stall may prompt Brussels to adopt a more pro-growth policy stance.  That would be welcomed news, particularly to the Italians.  Stay tuned.

Source: German Federal Statistics Office, Bloomberg LP

WCM Chart of the Week for Feb. 6, 2019

The MSCI USA Cyclical Sectors – Defensive Sectors Index measures the performance differential of sectors such as Technology and Consumer Discretionary versus traditional defensive sectors such as Utilities, Telecommunications and Consumer Staples.  After suffering one of the worst corrections since 2011, the index appears to have begun to recover.  It is no secret that risk assets have rallied strongly so far this year, but if the rebound in this index can be sustained, broader gains in the US equity market and other riskier asset should continue.

The index corrections that we experienced earlier in the decade were related to concerns about global growth.  In the 2010-2013 period, the volatility centered mainly on the viability of the Eurozone and economic stress in Portugal, Ireland, Italy, Greece and Spain (PIIGS).  Now Italy appears headed towards recession while Germany and France are also facing headwinds.  The beginning of 2016 also marked a period of heightened index volatility due to Chinese growth concerns.  Similar issues in these key segments of the global economy persist, but the US Federal Reserve is now perceived to be much more accommodative after setting a more hawkish and restrictive tone in the Fall of 2018.

« Older posts Newer posts »