Author: WCM (Page 2 of 9)

WCM Chart of the Week for July 12, 2019

Welcome back from holiday. GDP growth in the Middle Kingdom has been slowing over the past several years and, as the world’s second largest economy, it has a significant influence on global capital markets.  Our concern is that, while recent fiscal and monetary stimulus may have had initial positive effects, the impact may not be sustainable longer term.  The country needs robust economic growth in order to support job growth and placate social unrest.  Stronger growth would also help avoid a potential debt crisis as the pace of bankruptcies is accelerating – one indication that growth may not be as strong as it appears.

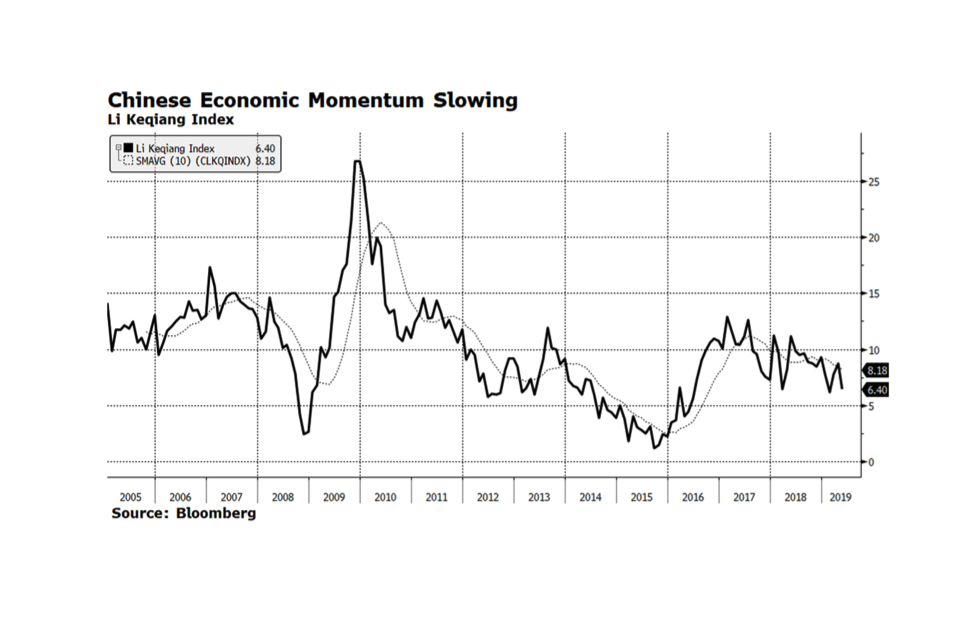
The official government figures for GDP growth – which we view with some doubt – stands at 6.4%, a level consistent with the Bloomberg Li Keqiang Index.  The index itself has its limitations but measures the growth in bank lending, freight shipments and electricity consumption.  It tends to over and undershoot the official figures and may provide a more realistic view on economic conditions in China.  This indicator nonetheless bears monitoring as we await the June reading that will be out in days. [Chart courtesy Bloomberg LP (c)2019]

WCM Chart of the Week for June 27, 2019

The dollar has weakened considerably over the course of the past few weeks after having strengthened for much of the year.  It has fallen below its long term trend (the 200-day moving average) which in the past has led to further weakness.  The decline in US interest rates and expectations for further reductions in policy rates by the Fed are likely behind the dollar’s fall yet it is difficult to make the case for the dollar’s value to decline further against major currencies.  Economic activity in the US is stronger than all other major economies (with the exception of China, which is slowing) and the yield on the 10-year US Treasury is positive while comparable rates in much of the developed world are negative.  Currency movements are notoriously challenging to predict, but the dollar could decline more despite US economic strength as the other major currency values normalize to levels seen earlier in the decade. [chart courtesy Bloomberg LP (c) 2019]

Courtesy Bloomberg LP (c) 2019

WCM Chart of the Week for June 19, 2019

With many investors pining for the US Federal Reserve to begin lowering the Fed funds rate at the conclusion of its’ policy meeting today, the aftermath of late cycle rate declines can serve as an ominous reality check.  Few question that the US economy’s advance is in its latter stages with the current expansion lasting over a decade.  Yet lower policy rates may not be a panacea. The past three recessions have been preceded by late cycle rate declines orchestrated by the Fed.  US equities have not fared well during those lower rate regimes collapsing 15.3% in 1990, 22.1% in 2000-02 and 25.9% 2007-09.  The key for investors is if the Fed can re-kindle activity in areas of the economy that have weakened lately, avoiding recession and an adverse reaction in the stock market.  Another factor is Fed credibility give its policy U-turn to this year’s more dovish stance after hawkish comments made towards the end of 2018.  This cycle could be different.  We could see modest downward rate adjustments like we experienced in the mid-to-late 1990s which helped fuel the Tech-driven bull market.

WCM Chart of the Week for June 13, 2019

Investor sentiment in the US is bearish as the American Association of Individual Investors’ net bull minus bear spread currently registered its third negative reading and now stands at -7.36.  That is the bad news. But, this contrarian metric can signal market upward and downward shifts when registering positive or negative extremes.  The gauge registered -20 last week, so the most recent figure, although still negative, is an improvement and could provide psychological support to carry further gains in US stocks.

WCM Chart of the Week for June 6, 2019

The American consumer remains fairly strong, and yet the retail sector is not keeping pace with the broader market. What is wrong with retail then? Our view, which is consistent with those of portfolio managers that we follow and respect, is that the US is simply “over-retailed”. There are too many ways and places to buy the exact same things. Yes we are seeing structural changes as we lurch forward (backward?) to the good old days of catalog shopping and home delivery, just in the shiny wrapper of smart phone apps and curated boxes. But, the old channels are suffering but have not gone away. Yet. There are zombie brands that should have winked out of existence years ago that trudge along on fumes, debt or hedge fund and private investment. We are still surrounded by big boxes, shopping centers, strip malls, mega-malls, outlet malls and Main Street, but what we can buy across all channels, physical and virtual, is homogeneous. Experiences are driving consumer channel behavior. Service, price and convenience are the factors that will force the inevitable and messy shakeout. Until there is some real carnage and consolidation, expect retail to be a challenging place to outperform.

WCM Chart of the Week for May 30, 2019

The yield on the 10-year US Treasury has fallen to 2.22% (as of May 29th) which is 100 basis points from the recent high reached on November 8, 2018. The rapid decline in rates, 29.8% from last November’s levels, has many investors unnerved as a portion of the yield curve is inverted. That historically has signaled oncoming recessions. Interest rates could fall further from here. Over the past decade, there have been at least seven distinct periods where yields have fallen, averaging over 39% from peak-to-trough. The duration of those periods averaged 7.6 months while the current downtrend has lasted six months, 11 days and counting. There are several reasons why rates could continue to fall, ranging from the ongoing and unpredictable effects of the US-China trade negotiations, political disfunction in the EU and Great Britain, the lack of inflationary pressures globally and negative interest rates for comparable government bonds in Germany and Japan.  The risk for investors chasing this treasury rally is that any escalation in yields from these low levels would result in material loss of principal. [chart courtesy Bloomberg LP (c) 2019]

WCM Chart of the Week for May 21, 2019

Monday’s remarks by Jerome Powell, Chairman of the US Federal Reserve, raised some eyebrows in financial circles.  He stated “Business debt has clearly reached a level that should give businesses and investors reason to pause and reflect” and “Another sharp increase… could increase vulnerabilities appreciably”.  These comments prompted some investors to draw comparisons to the mortgage crisis. The chart below shows US corporate debt to GDP levels, currently at a 30-year high of 50.1% (vertical axis), and it is alarming.  Not only does the current reading exceed the Financial Crisis but the measure also exceeds readings reached during the debt-fueled technology bubble era. One major difference today is that during both previous crises, interest rates (yield-to-worst according to the Bloomberg Barclays US Corporate Debt Index) were near or above 8% whereas now rates stand at 3.6%.  Powell did qualify his comments by adding that debt servicing costs remain low and debt growth is in line with GDP growth. Cold comfort unless rates remain structurally lower for longer.

Chart Courtesy Bloomberg LP (c) 2019

WCM COTW for May 14, 2019

US stock markets have continued to be roiled by ongoing US-China trade negotiations. Departing Washington DC last Friday, Beijing issued a strong statement challenging US demands for fairer trade. The core issue for the Chinese is that the US is forcing the Chinese to change their laws regarding intellectual property protection, dispute resolution enforcement, and mandatory joint ventures, among other issues.  That is seen as an affront to Chinese sovereignty.  Beijing needs to “save face”, avoiding being seen as a weakened nation from a domestic perspective and just as importantly throughout the region.  To form a trade agreement with the US, China’s lead negotiator Liu He will have to concede on these points which will then form the template for other major trading partners such as Europe to follow.  Beijing probably realizes that, by giving ground to the US now, it is only a matter of time before their decades-long trading advantages evaporate.  While this major global event plays out, we expect more volatility and would not be surprised to see US stocks test or even trade through their long-term trends as depicted by this week’s S&P 500 Total Return chart.

WCM COTW for May 8, 2019

Interest rate spreads in the US High Yield bond market have risen recently after narrowing some 130 basis points since the beginning of the year.  While that is a concern, we point out that current readings are still below trend.  Comments from Pres. Trump over the weekend regarding tariff increases in trade negotiations with China have rattled stock and credit markets around the world and undoubtedly contributed to the near-term widening of US High Yield spreads.  How these negotiations play out towards the end of the week are critical for the capital markets. Key components of the earlier discussions – intellectual property protection, dispute resolution enforcement and freer market access – may be in jeopardy or be diluted. That could lead to economic disruption and derail the recovery in risk asset classes we have experienced so far this year.

WCM Chart of the Week for May 2, 2019

Bloomberg maintains a series of global and regional financial conditions indices that combine several key fixed income and equity market metrics such as interest rate spreads and volatility.  Taken together, this data gives an indication of how benign or strained conditions are in the capital markets. Currently, the reading in the US is positive, indicating a benign environment for risk asset classes.  It is important to recognize this indicator can maintain long periods of positive or negative readings but when it begins to move in a downward direction capital markets become stressed.  US financial conditions could continue to remain in a positive state due to favorable economic trends — low inflation, accommodative monetary policy, strong productivity gains, high labor participation and robust GDP growth.

« Older posts Newer posts »