Author: WCM (Page 4 of 9)

WCM Chart of the Week for Jan. 31, 2019

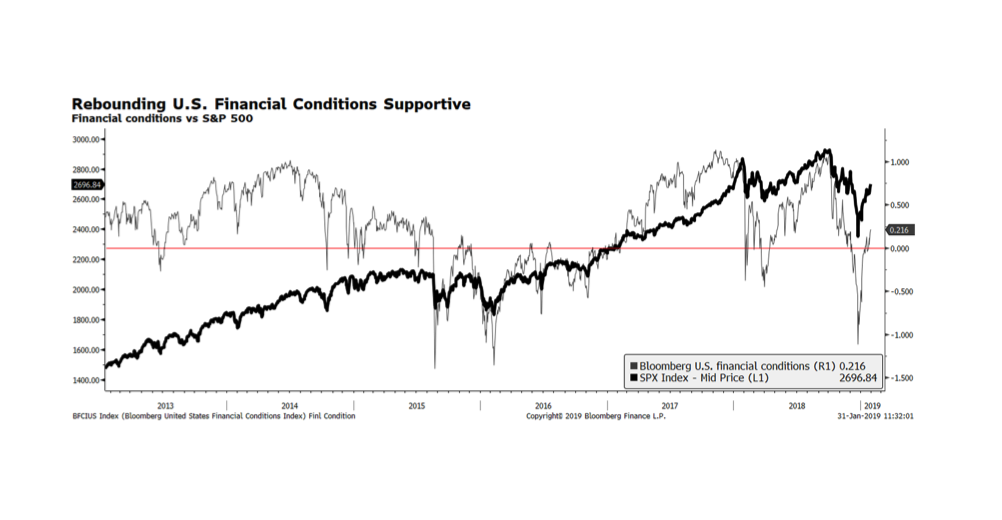
The Bloomberg US Financial Conditions Index measures the overall levels of stress in the US capital markets in order to evaluate the availability and cost of credit.  A positive reading suggests that financial conditions are benign whereas a negative reading indicates a more restrictive financial environment. This week’s chart shows this indicator (the thin line plotted on the right-hand vertical axis) alongside the S&P 500 (the thick line plotted on the left-hand vertical axis). When the financial conditions index worsens or turn negative, US stock prices tend to perform poorly.  The good news is that financial conditions have improved and are now positive according to this index which should be supportive of US equities and other risk assets going forward if this index can maintain positive momentum.  We stress that positive financial conditions can be short lived, as shown below, causing equities to struggle.  For the present, positive financial trends, attractive valuations and positive albeit slowing earnings growth should buoy US stock prices and other risk asset classes.

WCM Chart of the Week for Jan. 23, 2019

Markets have responded negatively to Monday’s release of a fourth quarter GDP growth rate of 6.4% by the Chinese government.  The reality is that growth in China has been moderating since the Great Recession, which should not be unexpected since China is now the world’s second largest economy next to the US. What has compounded matters is that the rest of the developed world, particularly the Eurozone, the UK and the US, also is showing signs of moderating economic activity.

There is also considerable speculation that the actual growth rate is lower than official government figures suggest.  The chart below depicts the official Chinese government figures and the Li Keqiang Index, an economic proxy index calculated by Bloomberg Economics, which combines growth rates in outstanding bank loans, electricity production, and rail freight volume.  The latter index is regarded by some as more timely as well as more accurate, and that may be true, but both indices are trending downward.  It is important to note that the Li Keqiang measure is in nominal terms and after adjusting for inflation, currently expected to be approximately 1.9%, in line with or even below the official GDP release.  Both indices are decelerating and it remains a viable consideration that economic growth could be even lower.

Bloomberg Finance, LP

WCM Chart of the Week for Jan. 16, 2019

Benign Inflationary Measures Give Central Banks Room to Maneuver

Global stock and credit markets have begun to regain lost ground after dovish comments from US Federal Reserve Chairman Powell and his predecessors Janet Yellen and Ben Bernanke.  Powell remarked that inflationary pressures are not evident and market participants interpreted that as a sign of less urgency for the Fed to continue to raise policy rates.  Inflationary readings are also declining in the Eurozone and Japan, bringing inflation in all three key regions below their stated 2.0% target (the red line on the chart).  With the prospect of imminent and continued interest rate hikes pushed further out in the year if at all, the environment for risk assets should remain supportive.  Yet, how the current US Government shut down, now the longest in history, unfolds remains a major concern.

WCM Chart of the Week for Jan. 9, 2019

20 Years of the Euro. As we head into 2019, the Euro marked its twentieth anniversary.  In the years leading up to the launch of the single European currency there was a tremendous amount of optimism and pride on the Continent based on the potential advantages a unified Europe offered — a population, economy and market that could rival and surpass the United States.  While those advantages are still true, the original fiscal requirements of the Maastricht Treaty, which harmonized national budget and debt ratios and allowed for the creation of the Euro, are now the root cause of currency and capital market volatility.  Those fiscal constraints have become burdensome for the peripheral European nations that historically have had less fiscal discipline than northern countries.  Over the past decade in particular, there have been a series of Euro-related crises that, in our opinion, will persist until Brussels relaxes these constraints.  Unfortunately, that would likely only provide temporary relief to the long-term structural issues that persist.

WCM Chart of the Week for Dec. 19, 2018

Today’s announcement of the US Federal Reserve’s decision to increase policy rates by 25 basis points was met with a violent market reaction. Up until the announcement at 2 pm EST, major indexes in the US had solid gains. However, in the hour that followed, the market shed all gains and turned markedly negative.  The intraday price decline in the S&P 500 —  highlighted on the chart below — surpassed 3.7% which is nearly double the intraday price moves we highlighted in last week’s chart.  What concerns us is that Chairman Powell’s dovish comments that the Fed now expects to raise rates twice next year, rather than three times as previously communicated, should have provided some relief. That clearly did not happen.  Even with supportive economic activity, strong corporate fundamentals and attractive valuation levels, the US stock markets remain fragile.

WCM Chart of the Week for Dec. 12, 2018

The past few weeks have been harrowing for investors, and since December, intraday price movements of the S&P 500 appear to be increasing.  There have been five consecutive days in which the index has swung up or down 2% or more.  Heightened intraday volatility usually precedes a change in market direction and is a key factor to monitor.  We are constantly searching for a trigger to put a bottom in equities but for now investors are focused on the outcome of next week’s Fed meeting and its impact on interest rates, along with political tension in Europe and the UK as well as tariff and trade friction between the US and China.

WCM Chart of the Week for Dec. 5, 2018

The US Federal Reserve may have greater flexibility in their efforts to manage policy rates higher due to benign inflationary trends. The personal consumption expenditure deflator has eased in recent months after reaching a multi-year high of 2.34% at the end of July. Strong economic growth, rising inflation and comments made by Fed Chairman Powell in the early Fall months that the central bank was not close to interest rate neutrality were likely significant factors in placing downward pressure on risk assets in recent months. However, last week Chairman Powell said that interest rates were “just below” neutral in a speech to the Economic Club of New York, causing capital markets here and abroad to rally before yesterday’s sharp drawdown. Other critical headwinds include the concern regarding peak corporate earnings and trade-related friction.

We still have a preference for US corporate securities over the rest of the world but are concerned that comments from US central bank leadership can produce such powerful market outcomes. An encouraging sign is market leadership is broadening particularly in the developing world over the past several weeks. A stable or weaker US dollar along with a weakening interest rate pressure could also provide a tailwind for the emerging equity and bond markets.

WCM Chart of the Week for Nov. 14, 2018

With the 2018 midterm elections behind us, volatility continues to persist in global equities with many investors questioning whether the long-term uptrend in US stocks has reached its end. We are constructive on US equities based on strong corporate fundamentals and a supportive economic backdrop. Furthermore, if history is a guide, equities typically produce positive 12-month returns after mid-term election cycles.

Historically, fourth quarter performance has been favorable albeit not uniformly positive. The chart below (courtesy of Bloomberg TV) shows Q4 total returns of the S&P 500 going back 30 years. There have only been five negative quarters since 1988 and the overall average is 4.8% with the steepest contractions following the dot com bubble bursting and during the financial crisis.

WCM Chart of the Week for Nov. 7, 2018

The US Federal Reserve is widely expected to continue on its pathway to higher policy rates at the December FOMC meeting. For the time being, the US economy appears that it can handle a more normal interest rate environment. Yet, economic conditions in the rest of the developed world — notably Japan and the Eurozone — remain sub-par at best and interest rates in those economies are stubbornly low. We wonder if the higher trajectory of interest rates in the US will force higher rates elsewhere internationally or will lower international rates keep US rates lower than normal. We would prefer the former because if that occurred it could happen concurrently with economic recovery in the rest of the world. This relationship is critical, in our view, because it will likely continue to influence currency and capital market volatility going forward.

WCM Chart of the Week for Oct. 30, 2018

The euro has weakened considerably versus the US dollar this year and is currently testing support levels reached just a few months ago. Our concern is that there may be further weakness ahead as economic activity continue to be sluggish on the Continent – the key German economic engine appears to have stalled as the Bundesbank expects Q3 to exhibit zero growth although officials expect that to be temporary. Consensus forecasts (the dotted line on the chart below) may catch up to current prices placing further downward pressure on the currency. This is happening at a time when the ECB has indicated that it will begin to end quantitative easing exercises towards the end of the year.

« Older posts Newer posts »