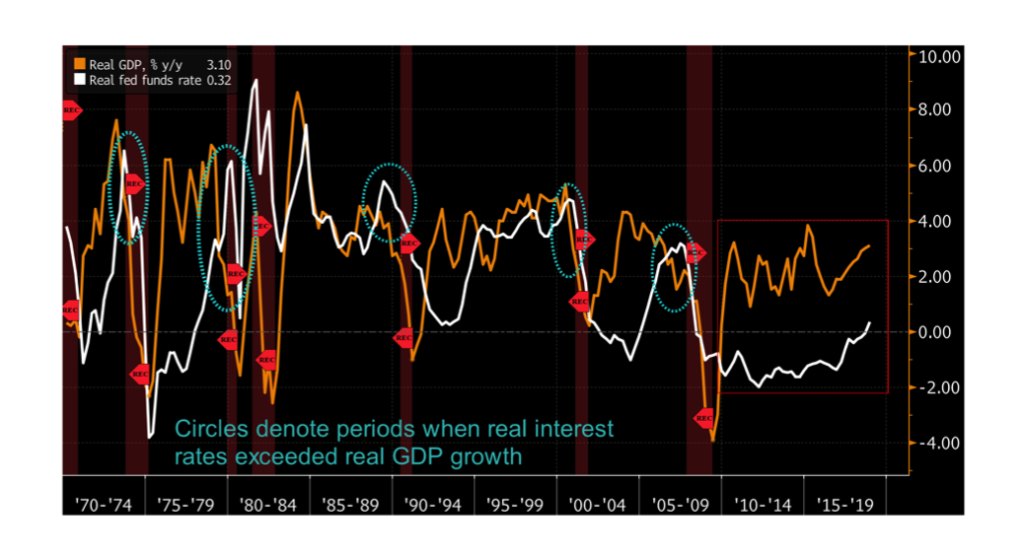
After the conclusion of US Federal Reserve’s scheduled meeting, Chairman Jerome Powell said that the Fed has reduced their planned Fed Funds rate increases to zero for the year by a unanimous 10-0 vote. Additionally, he announced that they would begin slowing the pace of balance sheet contraction beginning in June from $30 billion to $15 billion per month and end the planned shrinkage by September. These developments were received favorably by stock and bond markets because it signals that accommodative monetary policy will be supportive of asset prices. Investors have been concerned over the past several months that the Fed had adopted an overly restrictive monetary stance while economic conditions in the US were exhibiting signs of softening which could lead to recession. This week’s chart comes to us from the Bloomberg Economics team and shows the relationship between real US GDP growth and the real Fed Funds rate along with recessions going back nearly 50 years. The point the team makes is that, historically, the economy has yet to head into a recession with the real Fed Funds rate at current levels, and it is not until this key rate exceeds real GDP growth that a recession follows. Those occurrences are highlighted in the circles on the chart and do appear to be an early warning of recessions. We may have a fair amount of time before seeing those conditions develop.