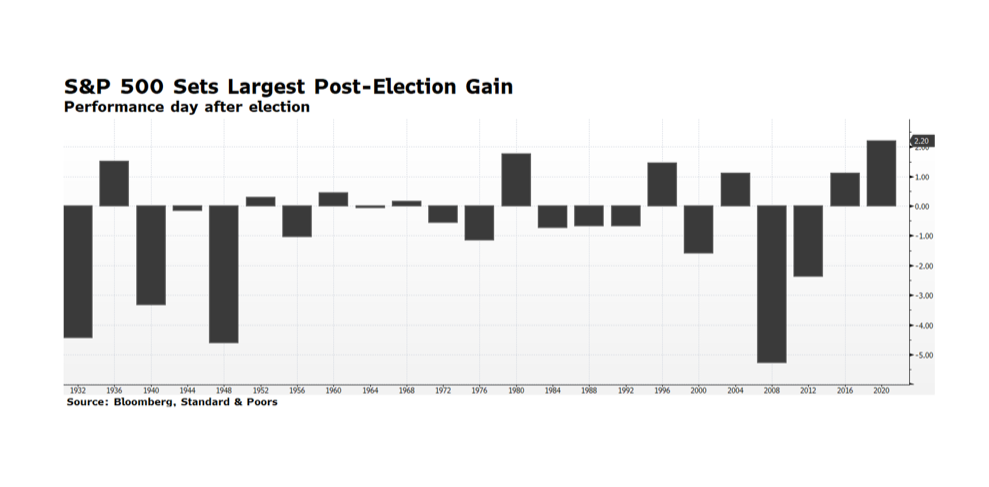
Category: Jobs and Employment (Page 2 of 3)

WCM Chart of the Week for September 11, 2020

August’s labor market statistics were encouraging and suggest that the US economic recovery is far from normal. According to the BLS, Nonfarm Payrolls expanded 1.37 million in August, slightly above expectations, and the unemployment rate dropped by more than expected to 8.4% versus consensus expectations of 9.8%. While the number of unemployed dropped by 2.8 million, there are still 13.6 million Americans out of a job, which is 7.8 million more than in February.  The nature of the recession, which appears to be largely behind us, is like none ever experienced because it was government induced nearly worldwide. Governments across the globe intentionally suppressed economic activity rather than act in their normal supportive role. Recessions are often caused by structural imbalances such as excess leverage in the financial sector, over-accommodative monetary policy causing hyper-extended stock market valuations, overvalued currencies and commodity price shocks.  These types of imbalances did not exist in the US for the most part prior to the pandemic and that may have set the conditions for a faster recovery. One dramatic example — over 10 million jobs have been recovered since April. By comparison, it took 54 months, from October 2010 to March 2015, for an equivalent number of jobs to be recreated in the aftermath of the Financial Crisis. [data from the US Bureau of Labor Statistics]

WCM Chart of the Week for August 28, 2020

The US stock market continues to rebound from the pandemic panic-driven lows, with the NASDAQ and S&P 500 continuing to post new all-time highs over the past several weeks. This is prompting investors to question if the current rally can last, or even if it marks the beginning of a new bull market.  There are risks that could derail the stock market’s advance ranging from tensions with China, resurging virus hot spots, social upheaval around the country, and the upcoming national elections. The US labor market is also a persistent drag and will not likely have recovered until well into 2021.

There are several factors that are supportive of asset prices including unprecedented fiscal and monetary support, and mounting positive momentum in key economic sectors such as manufacturing, housing and the consumer.  As previously mentioned in our COTWs, in the US personal savings rates remain elevated and personal balance sheets have been de-levered, suggesting the consumer has the ability to spend if they wish.  This week’s chart highlights total assets in money market funds, which remain near peak levels suggesting private investors have been underexposed to equities during the stock market’s historic recovery rally.  This is a condition many cite as additional evidence that equities could continue to advance higher in the months ahead. [chart courtesy Bloomberg LP © 2020]

WCM Chart of the Week for August 21, 2020

A few weeks ago we discussed US consumer trends, citing the elevated personal savings rate as reported by the BEA, in addition to citing expanding personal consumption. The relatively high personal savings rate suggests that there could be pent-up consumer demand to put that money to work. This week’s chart highlights total consumer credit outstanding, which has declined considerably since its pre-pandemic peak at the end of February. The decline in personal balance sheet leverage suggests that American households can access credit as needed or desired. This data is not very timely as June 30 is the most recent report, but it does suggest that the consumer is not as distressed as in previous recoveries.

The labor market continues to be the most restraining issue facing the economy — 14.8 million continuing jobless claims with initial claims amounting to 1.1 million this past week. But, the Bureau of Labor Statistics reported July payroll jobs expanded in 40 states, declined in one and were essentially flat in the remaining nine. We do need a broader and more inclusive jobs recovery because, as the BLS reports, the large increase in average hourly earnings is not good news — It reflects lower-paid workers being pushed out of the work force due to COVID-19 related business suspensions and closures. Strengthening trends in housing and manufacturing should spur further job growth and help restore this disenfranchised segment of the workforce. [Chart courtesy US Federal Reserve, Bloomberg LP (c) 2020]

WCM Chart of the Week for August 17, 2020

Over the last several months we have cited several factors that, in our view, explain why the US stock market indices have been rising and may continue to do so. The most significant contributors are measures being undertaken by the US Federal Reserve and Federal government to support the labor market. The US consumer has been responding by increasing consumption, and so we see core components of the US economy like auto purchases and manufacturing rebounding. The official unemployment rate is still terribly high, measuring 10.2% in July, but that is a significant improvement over 11.1% in June.

Pandemic-related government-mandated lockdowns are being lifted (although in some areas of the country those being reinstituted) and economic trends should continue to improve as people return to work and to consumption.  Critically, there are encouraging signs related to COVID-19.  According to the National Center for Health Statistics (part of the CDC), weekly total provisional deaths as of August 8th registered 438, lower than the pre-surge figure registered on March 21st. These totals are significantly lower than figures cited by media outlets and Johns Hopkins University, a consequence of how deaths are verified and reported, but most importantly we are seeing improving trends regardless of methodology, and that is a relief.  Very well known yet still necessary to point out, this week’s chart demonstrates the concentration of fatalities for those age 55 and older, showing the terrible risk to and impact on the elderly. But, by contrast, the low concentration and declining trend among the young may alleviate concerns about the upcoming school year and broadening re-openings across the country.

WCM Chart of the Week for August 7, 2020

According to the Bureau of Economic Analysis, Americans are saving their disposable income at unprecedented levels. The savings rate is persisting well above previous peaks reached during recessionary periods spanning nearly 35 years. Americans are sitting on their wallets for obvious reasons – fears of the coronavirus, government mandated lock-downs and broad feelings of economic insecurity. The overall rate, while declining steadily since its April peak of 33.5%, stands at a level that is two to three times the percentage of previous recessions. That suggests to us that there is pent-up demand that could help bring the economy out its current nadir. Personal spending has been rebounding, with June’s monthly figure climbing 5.6%, building on May’s 8.5% advance. We call attention to the fact that the June report beat expectations while May was revised upward. There is still a tremendous amount of uncertainty related to COVID-19, terrible stress in the labor market and the upcoming national elections in the US, but the American consumer is a powerful economic force that may prove to be spring-loaded. [chart courtesy BEA and Bloomberg LP © 2020]

Updates to our monthly newsletter format

WCM has made some changes to our monthly newsletter to make it more engaging and useful for our readers. First, we have moved our interpretive analysis of the month gone by to the front and expanded it. We follow that with our current portfolio positioning and what we see as the capstone risks to our stance. Lastly, we close with a performance survey of capital markets for the prior month, calling out what we see as the most consequential returns which played into both our thinking and our results.

As always, you can find our latest newsletter in the Library, along with an archive of prior newsletters. Thank you for reading!

WCM Chart of the Week for June 5, 2020

Economic fault lines run deep across America. Many of these lines have been laid bare as a consequence of the economic crisis unleashed by the COVID-19 outbreak, but the lines were there long before, and will continue long after. Those sitting on the bottom rungs of the prosperity ladder not only were among the most vulnerable as business, trade and service ground to a halt, they are in the worst position to participate in the recovery. Access to capital is critical to household and business formation, maintenance and growth. As recently as 2017, the last time the FDIC released its biennial national survey, 18.7% of American households were underbanked (relying on payday lenders, rent-to-own, pawn shops, refund anticipation loans, and other non-bank resources), and a full 6.5%, or nearly 8.5 million households, were completely unbanked. Without access to the financial infrastructure enjoyed by nearly 70% of the population, the road ahead will be difficult if not impossible, and investing in community financing through CDFIs and other non-traditional conduits will be critical to an inclusive recovery.

WCM Chart of the Week for May 22, 2020

A key contrarian indicator sustains bullish readings, at least for the time being. The American Association of Individual Investor bull-bear spread survey continues to post negative readings, which is not surprising given the dire news on the US economic front. The labor market alone shows initial jobless claims approaching 40 million. Positive economic indicators are rare, yet US stocks continue to rebound, establishing higher highs and higher lows. Equity investors, for now, are looking past day-to-day bad news and towards the recovery as the country re-opens. There are still risks as new consumption patterns emerge and the potential for a second wave of COVID-19 looms later in the year, but the repatriation of American manufacturing and key service functions will likely lead to higher median wages, greater sustainability, and stronger national security. These long-term trends, in our view, will continue to attract the marginal global investment dollar to the US capital markets. [Chart courtesy Bloomberg LP (c) 2020]

WCM Chart of the Week for May 8, 2020

US corporate credit spreads are narrowing, but they are still quite wide by historical standards. Investment grade spreads appear to be stabilizing while high yield (junk bond) spreads are still volatile. Yields premiums in both segments of the credit market have contracted by about half-way from their recent peak on March 23rd compared to their pre-pandemic levels. What we find interesting is that volatility persists in the high yield market given the Fed’s disclosure that they intend to purchase issues and instruments including ETFs within this credit market segment. The volatility is likely a signal that investors expect defaults, insolvencies and bankruptcies. What intrigues us is the potential for Fed purchases of ETFs, because the Fed could opt to receive the underlying bonds, hold them until maturity and absorb any resulting defaults. That would in effect support distressed companies and potentially preserve jobs. It may prove to be a novel way for the Fed to support the labor market using the balance sheet to honor its mandate for full employment. [chart courtesy Bloomberg LP © 2020]

WCM Chart of the Week for May 1, 2020

This past week we witnessed two of the worst US economic reports many of us have ever seen. On Wednesday, it was reported Q1 GDP contracted 4.8% on an annualized basis, and Thursday’s unemployment report brought the total number of newly unemployed to over 30 million, consuming all of the jobs gains since the depths of the Great Recession. But, even with all the bad news on the economic front over the past several weeks, the US stock market as measured by the S&P 500 posted its strongest monthly gain since 1987. At least for now, the stock market is looking beyond the current rut to the potential for prosperity on the other side. That is certainly reasonable considering the amount of monetary and fiscal stimulus being injected into the economy and capital markets as we have been discussing for several weeks. Against this backdrop we are still compelled to ask ourselves what the trigger for re-testing the March equity drop might be. It could be an acceleration of virus cases, a state-level bankruptcy or two, or China-related backlash or retaliation. Current state of mind – hopeful but watchful. [chart courtesy Standard & Poors and Bloomberg LP © 2020]

« Older posts Newer posts »