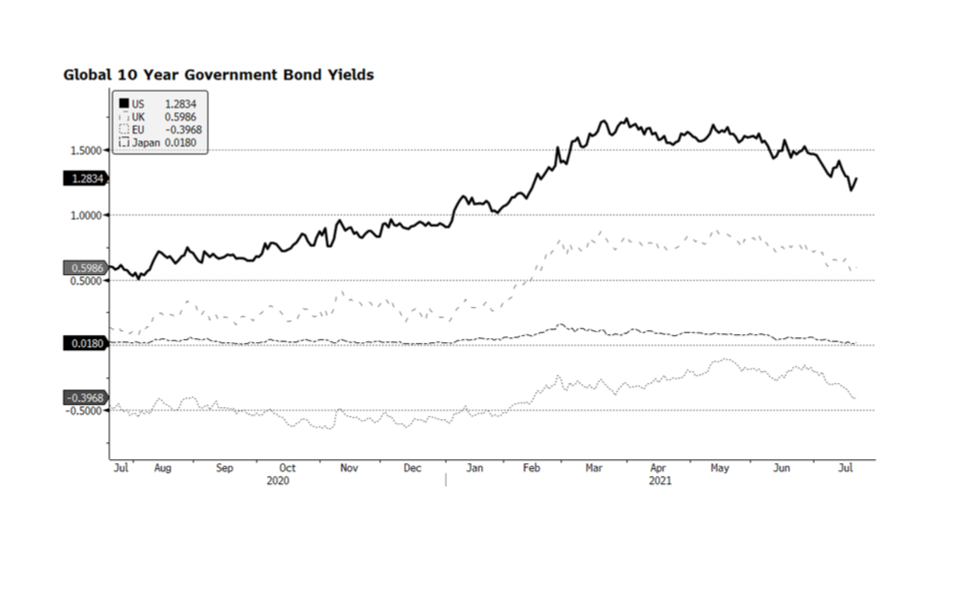
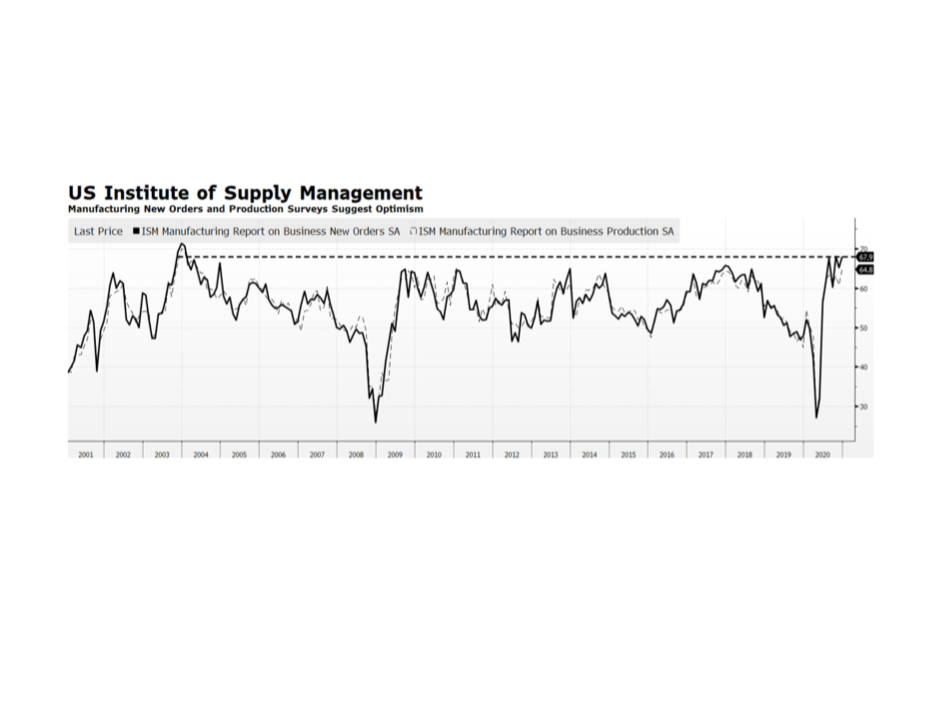
Looking at the markets the last several sessions, it would be easy to think this was a “hold my beer” moment after we posited the question in our last blog post about what could take these booming markets out. Right now we are saying take a moment and a healthy step back, look at the charts over the last six, twelve or eighteen months, and decide how agitated to get. Could it get worse? Sure, always could. Is there a clear reason that it should? In our opinion, not really. It does seem like the AI theme is a little exhausted after a massive run, Japan is a little exhausted after a massive run (and the carry trade may be winding down), and the jobs numbers in the US may be a bit exhausted after a massive run. In other words, a healthy consolidation after better outcomes than world markets and economies had any reason to expect after the pandemic, an overshoot on stimulus, and the consequent slamming on policy brakes. If the Middle East erupts into a hot shooting war that pulls in the West, we will need to re-rate our risk view, but right now, keep calm and look at the charts.
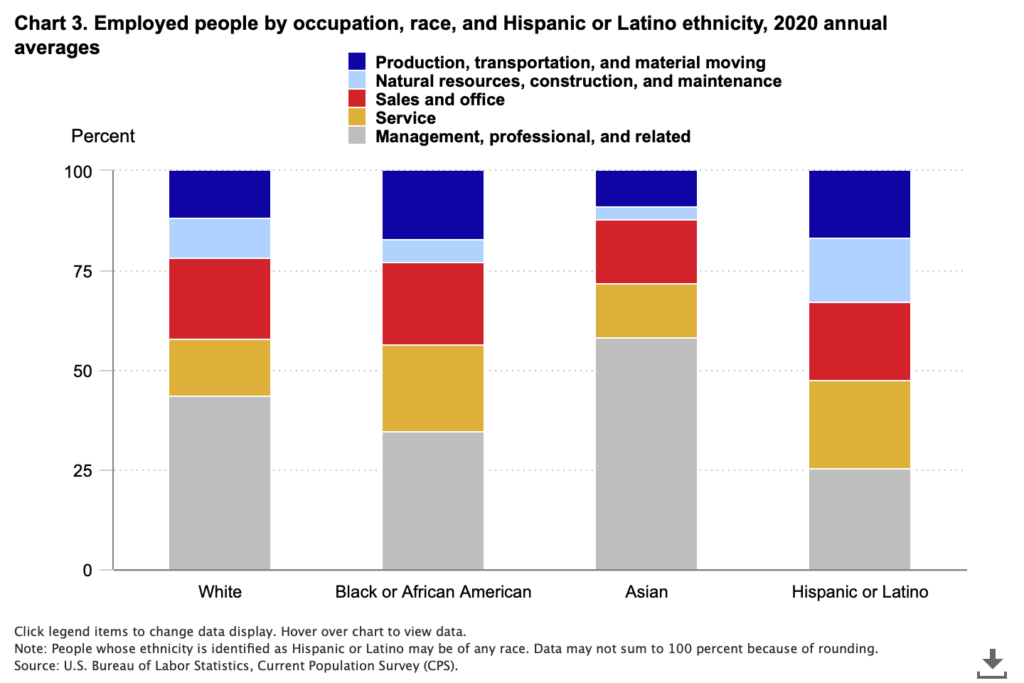
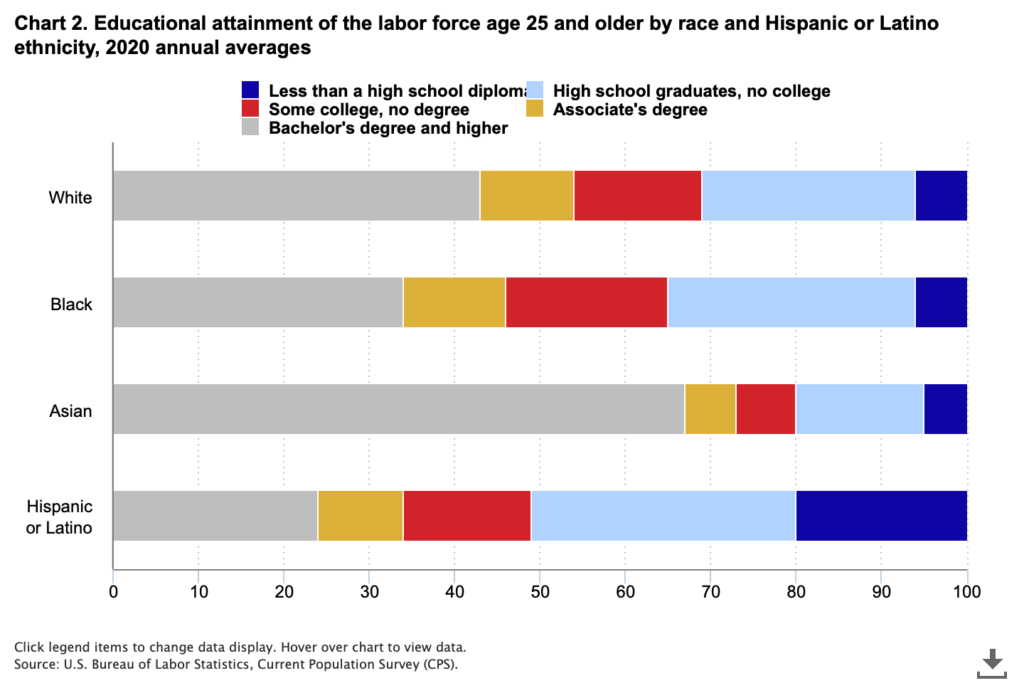
The subject of DE&I – diversity, equity, and inclusion – is having its moment in discussions about companies and workforces. Numerous studies have been conducted attempting to quantify the degree to which all manner of performance metrics improve when access and representation look more like the population at large. We are entirely supportive of a focus on DEI, but not necessarily the focus as it currently stands in the investment world. There is a strong impulse to count and score things to reduce the uncertainty of qualitative observations to quantitative data points, which is not unique to DEI or ESG. DEI happens to lend itself well to that approach because people can be counted. How many women? How many indigenous peoples? How many veterans? What we find is that counting or checking boxes can illuminate deficiencies, but does little to uncover how or why, and fails to understand the interdependencies between different categorizations, such as veterans and health and disability, or race/ethnicity and economic status and education. For instance, a company hiring STEM workers may come up short in its hiring of women or people of color, which could be a failure of policy and practice, or it could be that the supply of qualified candidates is insufficient because universities are not producing a diverse pool of graduates from which to draw. For us, it is a systems-level question. We start with the reasoned assumption that diverse, equitable and inclusive workplaces are more productive and more profitable as well as being more fundamentally just, but our focus is on the systems that perpetuate unproductive biases. That could be and often is rooted in discriminatory practices and systemic biases, but those biases do not exclusively live with the hiring manager or company nor are they fixable in the immediate term no matter how radical a policy shift is implemented. It takes time to establish systems of good governance, cultivate and develop talent, and equalize compensation and promotion opportunities, and those systems extend well beyond the four walls of a given company into our communities and our education, nutrition, health care and other civic services. High performance through an ESG lens where DEI is concerned is establishing and fostering systems and processes that naturally produce a more representative workforce by developing and improving the capability and capacity of candidate workers and opening access to opportunities. [charts courtesy US Bureau of Labor Statistics, Current Population Survey]
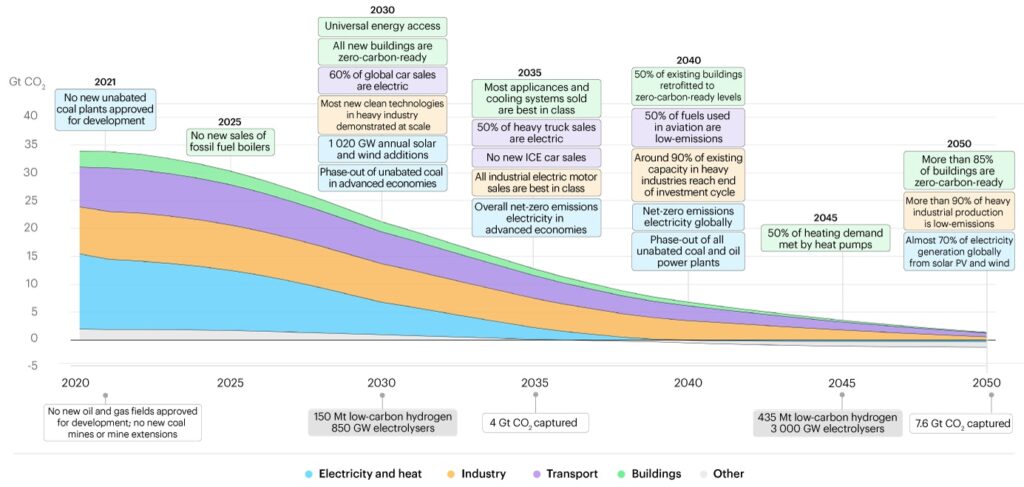
Yesterday a consortium of mostly Anglo and European countries signed a statement affirming a commitment to “deliver sustainable, green and inclusive economic growth to meet the challenge of decarbonising our economies, in line with limiting the global average temperature increase to 1.5°C above the preindustrial levels.” The statement covers six categories of targets — Support for workers in the transition to new jobs, social dialogue and stakeholder engagement, economic strategies, local, inclusive, and decent work, supply chains, and Paris Agreement reporting. The important thing we note in this statement is the recognition of the necessity of public/private partnership. The path to zero requires industry and market-wide activation of capital and corporate infrastructure in the private sector and regulatory and reporting frameworks from the public sector that facilitate the private sector’s work. This chart from a May 2021 International Energy Agency (IEA) report “Net Zero by 2050: A Roadmap for Global Energy Sector” provides an excellent overview of the business and industry targets that must be met with the facilitation and support of both governments and NGOs over the next 30 years. The signatories to the statement make sense in that these are many of the wealthiest industrialized nations that have both the capital to pursue this agenda and a high degree of responsibility for having brought us to the climate precipice. However, the lack of presence from Australia, China and Japan is concerning as they must help lead among the community of nations as the most developed and prosperous (polluting) countries of the Asia-Pacific region.
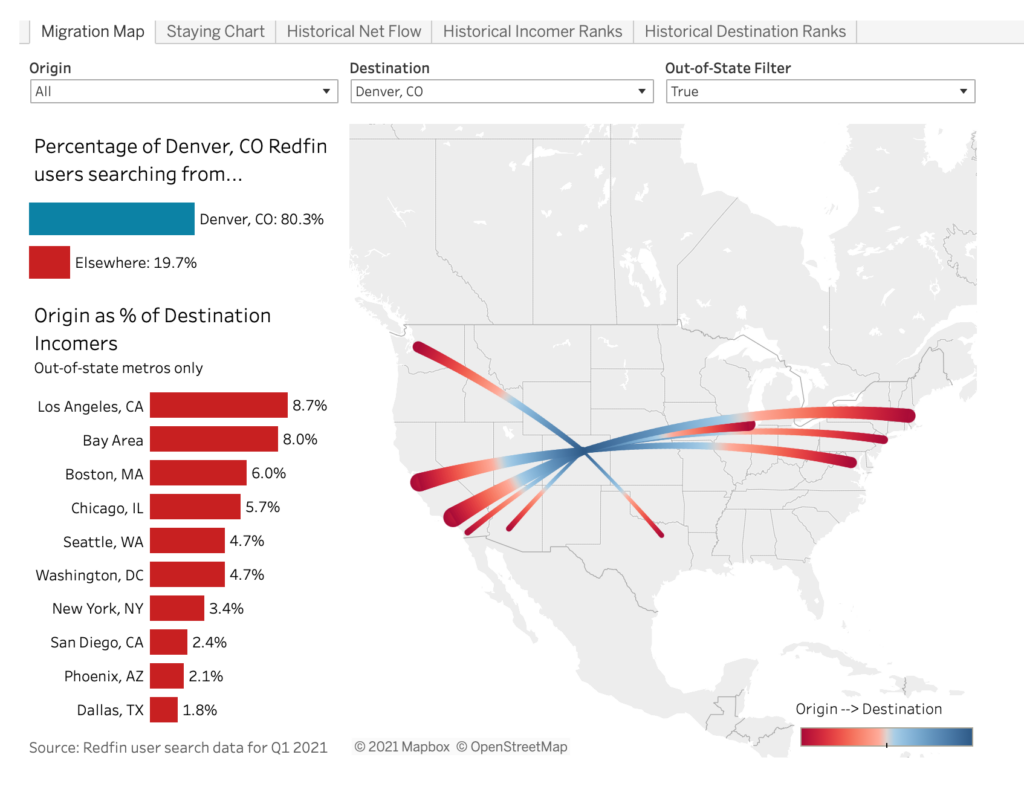
And we’re back. Everyone here is hoping everyone out there has taken some time to breathe a little of the relatively COVID-free air and begin to think about what a return to (the new) normal looks like. In that spirit, this week’s chart is from data provided by Redfin, a national real estate brokerage, on Q1 2021 relocation searches. One of the consequential impacts of COVID and the shutdown was an acceleration of outward migration from major urban centers. We are at a point in the generational cycle where it was to be expected with Millennials anyway, but the urgency was ramped up considerably. With companies reimagining what a workforce and a workplace look like, many people with knowledge economy jobs are able to quite literally work from anywhere. Residential real estate in less urban, less expensive and more desirable areas like Denver, CO (this week’s chart) have seen a crush of interest from urban economic centers and a rapid rise in prices as a result. We envision some of this will reverse, but much of the population movement is likely permanent, changing the economics of numerous communities across the country.
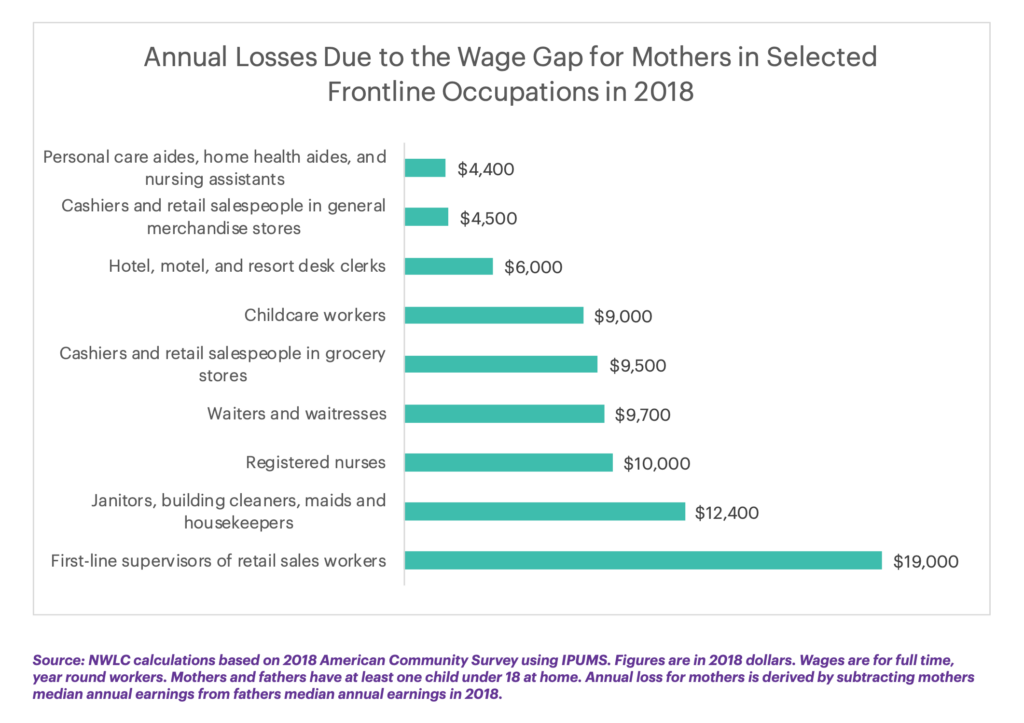
UN SDG 5 – “Achieve Gender Equality and Empower All Women and Girls”. During Women’s History Month we again turn our attention to equal access to economic opportunity for women in the American workforce. COVID has further exposed one of the ongoing issues with fair and equal compensation, which is the wage gap between women (and particularly women of color) who are mothers and men who are fathers in the same roles. The National Women’s Law Center gathered data pre-pandemic (2018) assessing the compensation picture for frontline occupations which turned out to be the exact roles hurt worst through the last year of COVID, including housekeepers, retail, wait staff, childcare, home health and nursing. Between 15 and 35% are working mothers, and of those as much as 74% of color. The gap between working mothers and fathers ranged from 36 cents down to 13 cents per hour. That is a bit of an abstraction. This week’s chart, taken from the NWLC and the 2018 American Community Survey, illustrates that gap much more starkly in real dollars on an annual basis, and points to the downstream economic drag on food, housing, education, job training and other expenditures and investments families make for healthy living and vibrant communities and economies.