Category: General (Page 4 of 17)

WCM Chart of the Week for November 1, 2019

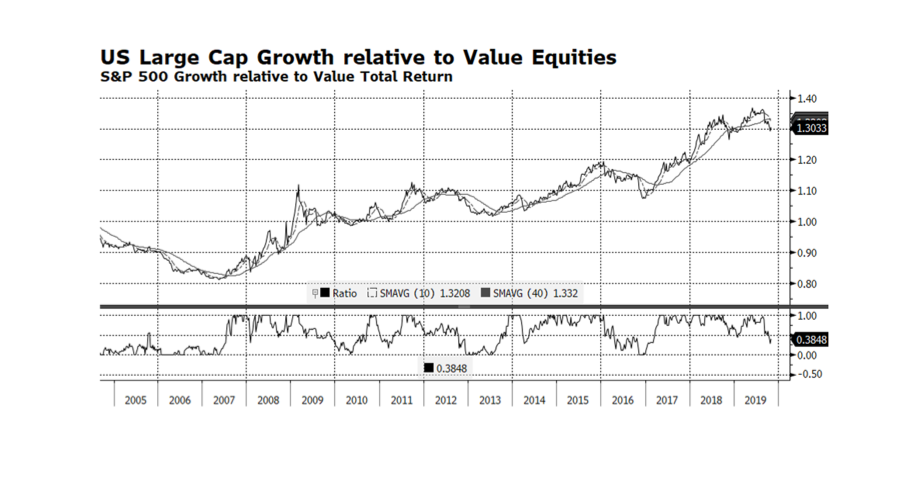
Growth stocks in the US have outperformed value stocks for the better part of the past three years with the exception of the US Fed induced sell off at the end of last year. However, since mid-August value stocks have outpaced growth stocks by a considerable amount rallying nearly 8% versus 3.5% according to S&P 500 Value and Growth indices.  If value stocks can continue to outperform or even keep pace with the overall market, we would view this as a positive development because it could mean that broader participation is developing.  That is important because the S&P 500’s largest the sector, Information Technology, continues to outperform, powering the market higher.  We find this interesting because usually technology stocks outperform with growth leading value. [chart courtesy Bloomberg LP © 2019]

WCM Chart of the Week for Oct. 11, 2019

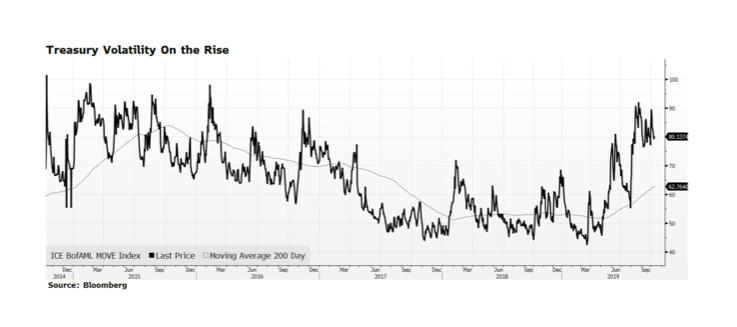
Volatility in US Treasury prices has been building for the past six months or so as measured by the ICE Bank of America Merrill Lynch Move Index. That is not all that surprising given the magnifying effect even small interest rate movements have on Treasury prices in today’s low rate environment.  The challenge investors face is that bonds, particularly longer-dated issues, offer anemic income streams and the likelihood of principal erosion as rates rise to more normal levels.  We continue to maintain lower duration within fixed income allocations than our benchmark because we believe that the long end of the yield curve, here and abroad, offers little investment merit and the potential for a great deal of volatility.

WCM Chart of the Week for September 6, 2019

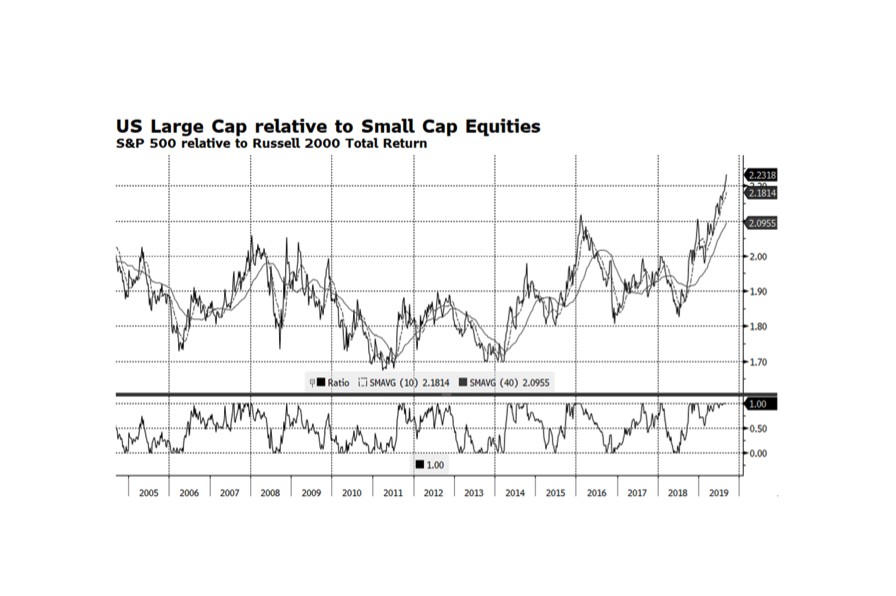
WCM Chart of the Week for September 6, 2019.  Large Cap US stocks continue to outperform with the S&P 500 total return reaching 20.7% YTD through (September 5, 2019).  This end of the US equity market, in particular, the Technology sector, contains the world’s strongest performers so far in 2019.  US Small Cap equities however have lagged considerably, only gaining 13.2% over the same time period while global stocks as measured by the FTSE Global All Cap Index have advanced 15.8%.

Economic trends in the US are much more favorable than in other key regions such as Europe and Asia. US Small Cap companies generally are more domestically oriented while Large US companies earn significant amount of revenue overseas.  Intuitively, the global environment should favor US Small Caps but that has not been the case.  The key might be the low interest rate environment enabling large companies to raise substantial amounts of debt through the corporate bond market while smaller companies are more dependent on regional bank financing. Another key factor explaining the performance disparity between Large and Small Cap stocks may be sector representation.  The financial sector of the S&P 500 represents roughly 12% of the index while the Russell 2000 has about 17%.  The financial sector has been a laggard overall and a small financial service company’s revenue is generally more dependent on lending which tends to struggle in low interest rate environments.

This week’s chart shows the total return relationship of US Large relative to Small Cap Equities.  Large Cap stocks are trading at their highest levels relative to Small Caps in at least the past 15 years and are clearly extended.  This is highly unusual but may persist at least until the US Federal Reserve ends its current rate cutting path and other monetary stimulus activities. [chart courtesy of Bloomberg LP (c)2019]

WCM Chart of the Week for August 30, 2019

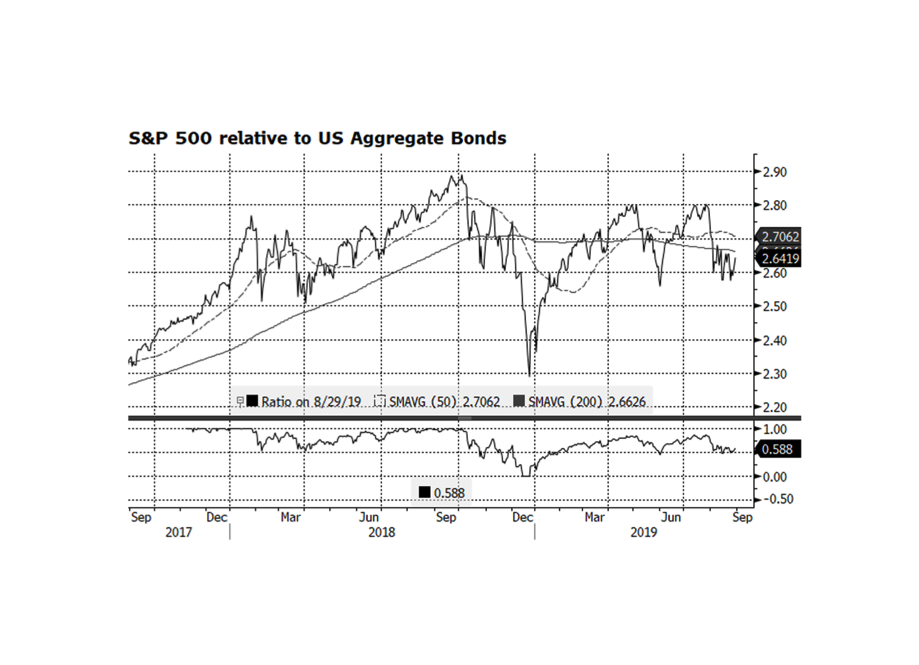
As we end the month of August US stocks have contracted 1.7% while US bonds have advanced 2.5% (through 8/29) and it seems like we have been in a tug of war between the asset classes since at least last fall.  Could we be at a pivot point when investors rotate back into equities?  The chart below shows the total return relationship between the S&P 500 and the Bloomberg Barclays Aggregate indices and it appears that large cap US stocks may be bottoming relative to bonds.  The bond market has been supported by a benign interest rate environment as the yield on the US 10 Year Treasury Bond has fallen from 2.68% at the beginning of the year to a low of 1.47% on August 27th.  There are several reasons why rates have fallen — no real inflationary pressures and lower and even negative interest rates in the rest of the developed world.  If rates stabilize around current levels, equities should regain leadership given that corporate fundamentals remain solid, market valuations are not elevated, and the US economy is still expanding. [Chart courtesy Bloomberg LP (c) 2019]

WCM Chart of the Week for August 23, 2019

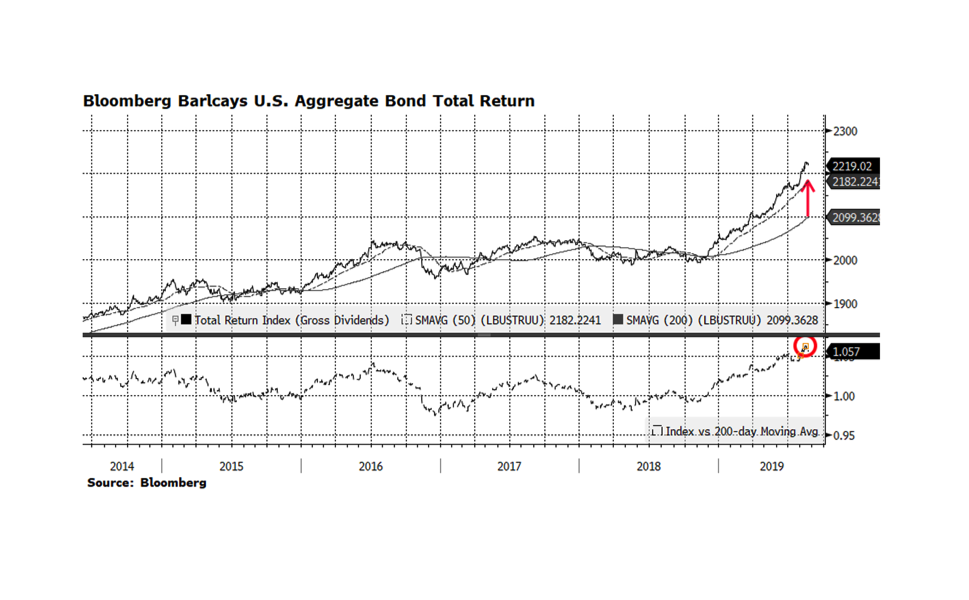
The US fixed income market has had a tremendous run so far in 2019. The Bloomberg Barclays US Aggregate has risen 8.4% through August 22nd. That performance is not surprising given that the 10-year US Treasury yield has fallen by roughly 50% from November 2018 to current levels. The overall fixed income market is overextended based on several fundamental metrics and it is overbought relative to its long-term trend. This week’s chart shows the aggregate index plotted with the 50 and 200-day moving averages in the top panel while the lower panel shows the ratio of the index to its long-term 200-day moving average.  The arrow on the top chart highlights the significant spread between the current level of the benchmark and the long-term trend.  Usually, when the index reaches elevated levels versus long-term trends, a consolidation or even modest correction follows. What concerns us is the ratio of this relationship (bottom panel) currently registers 1.057, the highest reading we have seen in the past five years. Forward 6- and 12-month total returns were mostly positive over the past 20 years when this ratio reached or even surpassed the current level largely because interest rates were higher than they are now.  With current interest rates so low, the ability of yield to overcome principle loss if or when rates rise is nonexistent in our view. This is the main reason why we continue to allocate towards shorter duration instruments with the fixed income portion of portfolios.

The Purpose of a Corporation

It will take some time to unpack both the intent and the implications of the Business Roundtable’s redefinition of the purpose of a corporation, but a quick meditation on their announcement on August 19th leads to a very confusing place for a sustainability-minded stakeholder.

On the surface, the “Statement on the Purpose of a Corporation”, co-signed by 181 CEOs, seems like a tectonic shift in the alignment of stakeholder values. At long last, corporations are committing to prioritize something beyond unadulterated capitalism. The points they made and the rhetoric they used could have been taken right off the vision boards of a thousand responsible and sustainable investors. The five central principles they outlined are (direct quote from the Business Roundtable, August 19, 2019):

  • Delivering value to our customers. We will further the tradition of American companies leading the way in meeting or exceeding customer expectations. 
  • Investing in our employees. This starts with compensating them fairly and providing important benefits. It also includes supporting them through training and education that help develop new skills for a rapidly changing world. We foster diversity and inclusion, dignity and respect.
  • Dealing fairly and ethically with our suppliers. We are dedicated to serving as good partners to the other companies, large and small, that help us meet our missions. 
  • Supporting the communities in which we work. We respect the people in our communities and protect the environment by embracing sustainable practices across our businesses.
  • Generating long-term value for shareholders, who provide the capital that allows companies to invest, grow and innovate. We are committed to transparency and effective engagement with shareholders.

These principles actually vibrate on the same wavelength as the Certified B Corporation “Declaration of Interdependence”:

  • That we must be the change we seek in the world.
  • That all business ought to be conducted as if people and place mattered.
  • That, through their products, practices, and profits, businesses should aspire to do no harm and benefit all.
  • To do so requires that we act with the understanding that we are each dependent upon another and thus responsible for each other and future generations.

So where’s the fly swimming in the punchbowl? The sub-heading for the Roundtable’s press release said the following – “Updated Statement Moves Away from Shareholder Primacy, Includes Commitment to All Stakeholders”. Again, at face value this is a good thing putting aside profit and shareholder value as the priority above all others. But, this announcement lands almost contemporaneously with an announcement that the SEC would be holding meetings to discuss a plan on the table to reign in proxy advisory firms (a prior discussion of this move from Cydney Posner, Cooley LLP on the Harvard Law School Forum on Corporate Governance and Financial Regulation can be found here), and during a period where the SEC has been increasingly lining up with companies to brush back shareholder resolutions and keep them off the proxy ballots. This move to limit the shareholder franchise has taken the form of questioning the materiality of the resolution to the overall business, as well as inching toward requiring a minimum percentage of ownership in order to sponsor a resolution. 

The danger here is that the confluence of disenfranchising shareholders with this new announcement from the Business Roundtable could actually mean a net setback if sustainable business behavior is defined almost exclusively by what management says it is without the input from and the natural corrective of the shareholder. That fifth principle is the linchpin to whether this will work or not – being “…committed to transparency and effective engagement with shareholders.” If the SEC defangs the shareholder, what does that actually mean in practice? We have seen repeated examples from aerospace to pharmaceuticals where self-supervision and fast-track regulation lead to bad outcomes for all stakeholders.

The Roundtable is on the right track if these principles are pursued in a regulatory environment that preserves an appropriate level of governance and accountability for shareholders, who are ultimately the only ones that have the ability to hold managements fully responsible in a free market. Employees can quit, customers can boycott and suppliers can freeze their pipelines, but boards and C-suite executives work for the shareholders.
WCM Chart of the Week for August 8, 2019

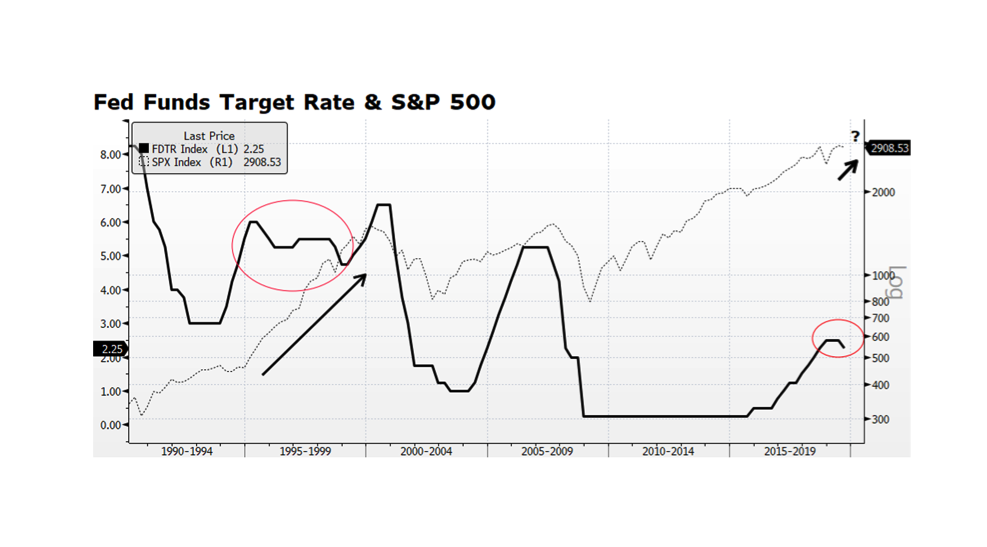
There has been little doubt in investors’ minds that monetary policy has played a critical role in supporting the global economy and capital markets for several decades.  Lately, the focus has been on how many times (and for how long) the US Federal Reserve will cut its Target Rate this cycle.  The current US economic expansion is the longest on record, and the question is whether late cycle rate cuts can sustain growth and the upward trajectory in the US stock market.  The most recent prior period we had a mid-to-late cycle reduction in the Fed Funds Target Rate was during the Alan Greenspan era when easy monetary policy fueled the Technology-driven bull market during the 1990s.  In the aftermath of the Tech bubble bursting, Greenspan was criticized for being too accommodative and ultimately producing a deeper rout than otherwise could have been.  Many forget that the rationale for easy monetary policy at the time was in part a response to the Asian currency crisis that spread from Thailand throughout South East Asia in 1997.  The current US Fed actions are a response to global economic weakness and should ultimately provide support for stock markets around the world.  A critical difference this time around is that fundamentals and valuations in the US stock market are far stronger than we experienced during the late 1990s. [chart courtesy Bloomberg LP (c) 2019]

Chart courtesy Bloomberg LP (c) 2019

WCM Chart of the Week for July 17, 2019

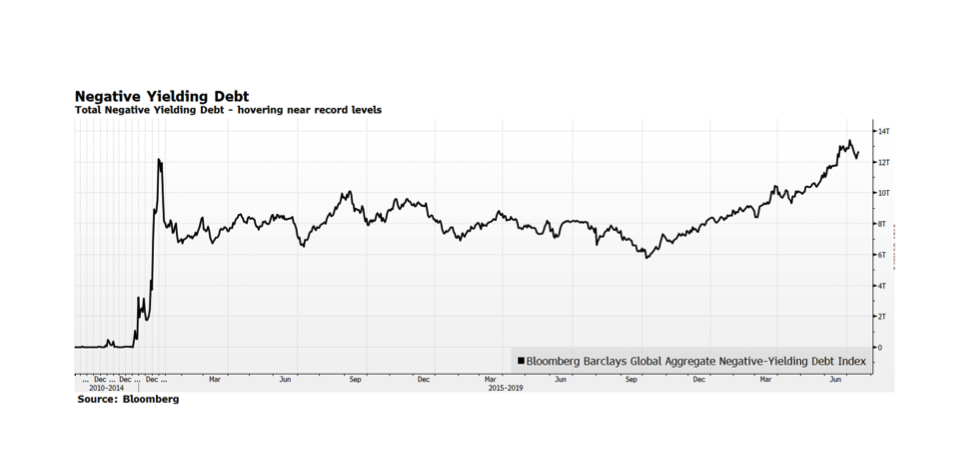
The total amount of negative yielding debt has been steadily climbing (in fact doubling) since last September, and now stands at a staggering $12.7 trillion dollars according the Bloomberg Global Aggregate Negative-Yielding Debt Index.  Negative yielding debt now represents over 23% of the Bloomberg Global Aggregate Index and consists of both investment grade corporate and sovereign bonds, predominantly in Continental Europe and Japan, areas of the capital markets we have avoided.  Hyper-accommodative monetary policy throughout the world in the form of quantitative easing, and negative interest rate policy in particular, is the main impetus producing this upside-down phenomenon of forcing investors to pay to hold bonds.  The risk is that this negative income stream situation will be adversely compounded as interest rates ultimately rise, risking principal, in our view.  We are concerned how long these conditions can persist and the ultimate fallout on the real economy and capital markets.

Chart courtesy Bloomberg LP (c) 2019

WCM Chart of the Week for June 27, 2019

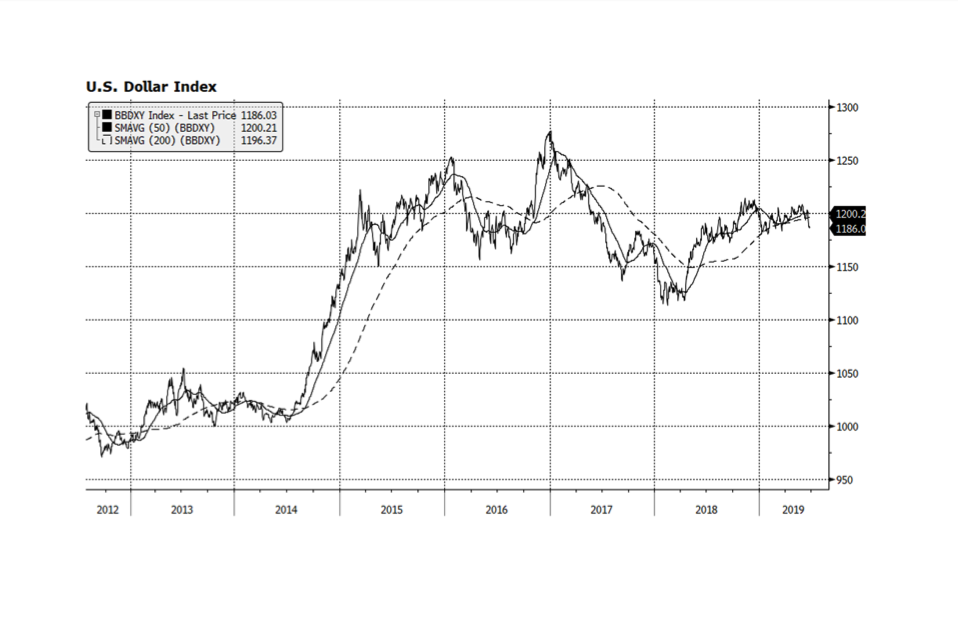
The dollar has weakened considerably over the course of the past few weeks after having strengthened for much of the year.  It has fallen below its long term trend (the 200-day moving average) which in the past has led to further weakness.  The decline in US interest rates and expectations for further reductions in policy rates by the Fed are likely behind the dollar’s fall yet it is difficult to make the case for the dollar’s value to decline further against major currencies.  Economic activity in the US is stronger than all other major economies (with the exception of China, which is slowing) and the yield on the 10-year US Treasury is positive while comparable rates in much of the developed world are negative.  Currency movements are notoriously challenging to predict, but the dollar could decline more despite US economic strength as the other major currency values normalize to levels seen earlier in the decade. [chart courtesy Bloomberg LP (c) 2019]

Courtesy Bloomberg LP (c) 2019

WCM Chart of the Week for June 19, 2019

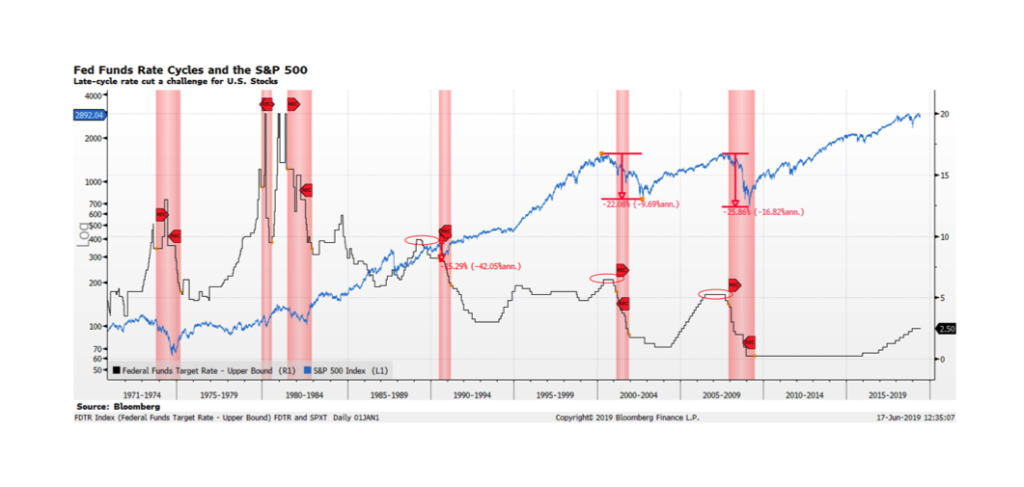
With many investors pining for the US Federal Reserve to begin lowering the Fed funds rate at the conclusion of its’ policy meeting today, the aftermath of late cycle rate declines can serve as an ominous reality check.  Few question that the US economy’s advance is in its latter stages with the current expansion lasting over a decade.  Yet lower policy rates may not be a panacea. The past three recessions have been preceded by late cycle rate declines orchestrated by the Fed.  US equities have not fared well during those lower rate regimes collapsing 15.3% in 1990, 22.1% in 2000-02 and 25.9% 2007-09.  The key for investors is if the Fed can re-kindle activity in areas of the economy that have weakened lately, avoiding recession and an adverse reaction in the stock market.  Another factor is Fed credibility give its policy U-turn to this year’s more dovish stance after hawkish comments made towards the end of 2018.  This cycle could be different.  We could see modest downward rate adjustments like we experienced in the mid-to-late 1990s which helped fuel the Tech-driven bull market.

« Older posts Newer posts »