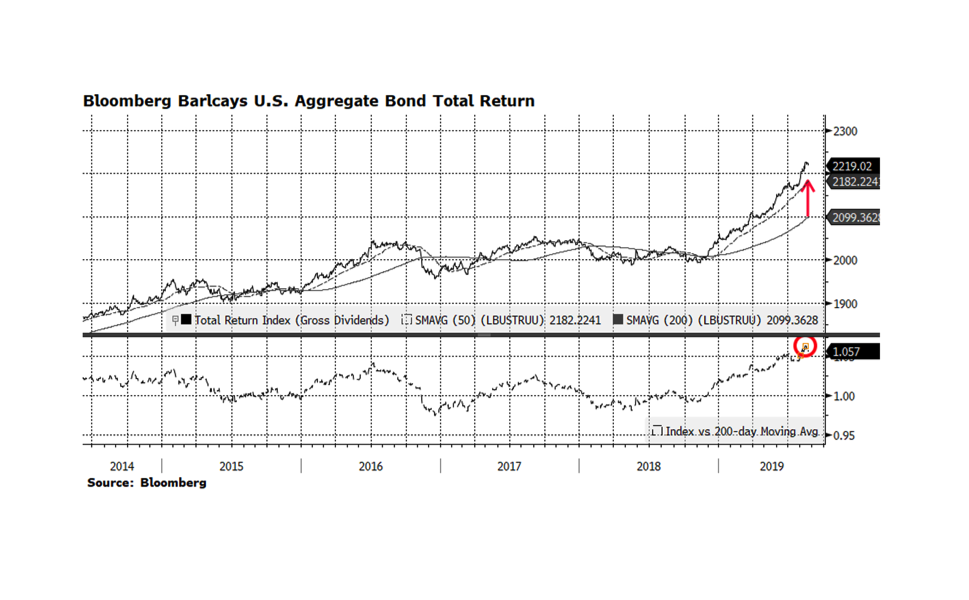
The US fixed income market has had a tremendous run so far in 2019. The Bloomberg Barclays US Aggregate has risen 8.4% through August 22nd. That performance is not surprising given that the 10-year US Treasury yield has fallen by roughly 50% from November 2018 to current levels. The overall fixed income market is overextended based on several fundamental metrics and it is overbought relative to its long-term trend. This week’s chart shows the aggregate index plotted with the 50 and 200-day moving averages in the top panel while the lower panel shows the ratio of the index to its long-term 200-day moving average. The arrow on the top chart highlights the significant spread between the current level of the benchmark and the long-term trend. Usually, when the index reaches elevated levels versus long-term trends, a consolidation or even modest correction follows. What concerns us is the ratio of this relationship (bottom panel) currently registers 1.057, the highest reading we have seen in the past five years. Forward 6- and 12-month total returns were mostly positive over the past 20 years when this ratio reached or even surpassed the current level largely because interest rates were higher than they are now. With current interest rates so low, the ability of yield to overcome principle loss if or when rates rise is nonexistent in our view. This is the main reason why we continue to allocate towards shorter duration instruments with the fixed income portion of portfolios.