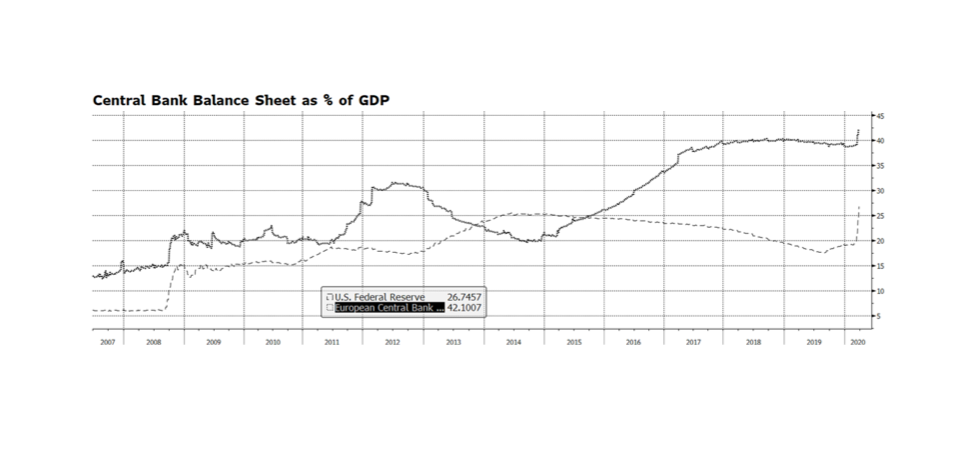
The US Federal Reserve has taken several powerful steps in recent weeks ranging from lowering policy interest rates, intervening in credit markets to provide stability and re-engaging in asset purchases, also known as QE. The amount of monetary stimulus is unprecedented and staggering. Since March 4, the Fed’s balance sheet has expanded nearly $1.6 trillion through their asset purchase plan, accumulating Mortgage Backed Securities, Treasuries and Corporate Credit. That is an incredible amount of expansion in such a short period of time considering that it took some 15 months during the financial crisis from when the QE program began to reach an equivalent level of assets. Some are concerned that the Fed has expended all of its monetary tools and that is a real concern given policy rates are at or near zero. The balance sheet now stands near $5.9 trillion, a level that just a few years ago would have seemed unimaginable. But it could become even larger. The Fed’s balance sheet represents nearly 27% of US GDP. By contrast the European Central Bank’s balance sheet stands at over 42% of European Union GDP. The Bank of Japan stands at over 100% of GDP. The Fed’s asset purchase program could even become more active and remain manageable, especially considering the relative vibrancy of our economy compared to Europe and Japan. [chart courtesy Bloomberg LP © 2020]
Category: General (Page 3 of 17)
At the peak of the Financial Crisis in the stretch from 2007 to 2009, we became familiar with the notion of systemically important institutions. With the failure of major banks and investment banks like Bear Stearns, Lehman Brothers, Countrywide and Washington Mutual, the private and public sectors had to come to grips with the idea that for-profit businesses could be so essential to the orderly functioning of the overall capitalist system that they could not be allowed to fail, even if that required the rescue of a public company with taxpayer money. This notion gave rise in part to a series of laws and regulations including the Dodd-Frank Wall Street Reform and Consumer Protection Act. Certain financial institutions were too important either by virtue of function or size or both to be allowed to fail, undermining confidence and the orderly conduct of our economy and markets. These institutions would be protected, but they would also be more critically regulated to mitigate the risk of failure.
Whether standing in long lines of anxious neighbors to stock up on staples or watching a public address from the White House rose garden, we have been presented with a new and really more fundamental notion of what a systemically important business is. In fact, the shelter-in-place approach to mitigating the spread of COVID-19 has created a new class of systemically important businesses as we redefine, on the fly, what used to be luxuries like working from home or having household staples delivered as now being existential.
Through the present market turmoil, it is difficult to see this new order clearly, but in the months and years to come we will collectively be forced to reflect on what we are learning through experience now. There are fundamentals to the orderly functioning of communities and societies that we all know intuitively, and yet we continually fail to prioritize until we are tested. Right now we are sitting at the bottom of Maslow’s hierarchy of needs, focusing on physiological and safety needs. That’s health, food, water, shelter, personal security, financial security, and so on. Our current situation is depriving us of the ability to climb further and focus even on social belonging because of the paramount importance of the first two.
We can make light of the run on toilet paper, canned goods and hand sanitizer, but that is as explicit a manifestation as there is of what matters right now – health and hygiene and nutrition. The systemically important are food producers and grocery stores, pharmaceutical companies and pharmacies, hospitals and laboratories. They are also the providers of basic infrastructure, public and private, that keep the lights on, the water flowing, and goods and services moving from point A to point B so we can be home and be socially distant. We are also going to get a graphic look at how fragile the bottom of the economic ladder is where access to basic physiological and safety needs is not assured on a good day much less in the midst of a crisis.
From an investor’s perspective, this will cause a re-rating of securities according to what really matters when we are against the wall. From municipal finance to support hospitals and emergency workers to ownership of companies that are essential to the food supply chain, we will have a renewed and clarified sense of where our investment capital is the most needed and where it should be treated with the highest levels of stewardship and oversight, whether or not it is backstopped by government, because these companies and services are simply too systemically important to fail. And with that, there is an opportunity for companies and for governments to rethink stakeholder rights and responsibilities, and to provide best-in-class transparency and good governance and prioritize quality and longevity over short term rewards.
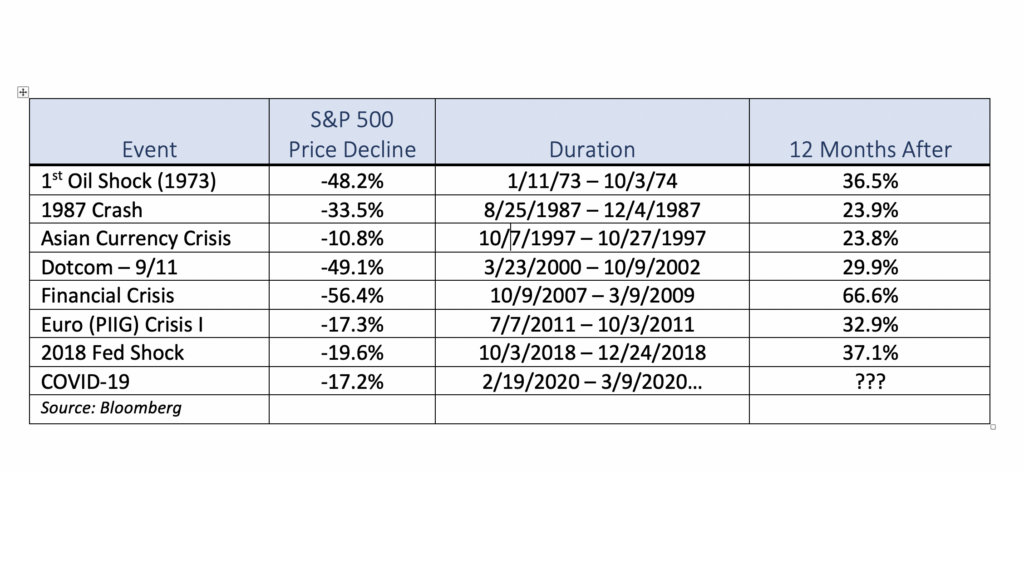
As of this writing stock markets around the globe are reacting violently to the latest COVID-19 related news. From our perspective, while the past several weeks of volatility has been unnerving, it is important to evaluate the current market in the context of previous global events. We have listed several periods over the span of the past 40 years when the US stock market, as measured by the S&P 500, either corrected or even entered a bear market. While this list is by no means exhaustive, it is intended to show that while previous downdrafts were painful, US equities rebounded impressively over the course of the following year once the market bottomed. It is also important to consider that each sell-off was caused by different events both international and domestic in origin as well as ranging in duration, yet stock prices in the US were higher 12 months afterwards. As tragic as this pandemic has been and will likely continue to be, our sense is that US equities will likely follow a similar pattern and be higher a year from now. [data courtesy Standard & Poor’s and Bloomberg LP © 2020]
Following are a few notes we shared with our clients and their trusted advisors earlier in the week that we think warrant repeating as we finish what has shaped up to be the worst week in the markets since the Financial Crisis.
COVID-19, popularly and generically referred to as “the (novel) coronavirus” has become that X factor we look for that comes from outside the markets and the normal news cycle to disrupt the status quo. While issues we have previously discussed like Brexit, the Hong Kong protests, and Iranian conflict are meaningful, markets generally take them in stride and try to price the risk. It may result in days or weeks of volatility, but eventually investors settle on how to value it. COVID-19, like Zika and SARS before it, is different. Brexit or HK are the product of people making active decisions. They may be decisions with adverse outcomes, but they are understandable, observable, and follow some kind of reasoning, whether or not we agree with it. Something like this virus introduces another dimension of uncertainty, because for now, we do not fully grasp the impact it will have on global health. So, even though we can observe and predict human decisions on how they are likely to respond to set information, the responses are and will continue to be dynamic based on the emerging understanding of and consequences of the virus.
We are not doctors, nor do we play them on TV, but we have been closely following not just the news cycle, but the output of expert organizations tasked with addressing this challenge. Indications continue to be that it is more easily spread than SARS and the bird flu, but the health impact appears to be less for healthy populations and the fatality rate lower for at-risk individuals, although most definitely and regrettably not zero. That does not mean this is something we take lightly either as investors or as global citizens. But it does help us chart a path forward. In the near term, the containment efforts are aggressive and the impact on society and commerce severe. As we have seen in China and now in South Korea, this has had an enormous impact on daily life and stopped business more or less in its tracks. The latest round of market reactions was triggered by a cluster of cases in Italy, which brings developed Europe into play. Emerging clusters in other areas like Iran suggest that with China as the vector, anywhere globally they have engagement and influence is a likely launch point for more cases. Inevitably this will lead to spread in parts of the world that either do not have the autocratic control of China or the health care infrastructure of Italy or Japan to address them, and we could see this accelerate to a global pandemic.
But, as counterintuitive as it sounds, from the investor’s perspective this may not be the worst thing. The economic damage being done is mostly from the preventative measures being taken to slow or stop the spread of the virus. Public transit is halted, air travel grounded, borders closed, events canceled, factories shut down, etc. If we find ourselves at a moment where these measures no longer restrain the spread of the illness, the focus will shift to healthcare and hygiene, as with seasonal flu and other communicable illnesses, and business ought to return to some semblance of normal. But in the near term, we are observing the volatility that comes with uncertainty, and also expect some degree of repricing as global economies absorb the consequences of lower activity. It is also not out of the realm of the possible that central banks will follow China’s lead and intervene to keep the economic engines running.
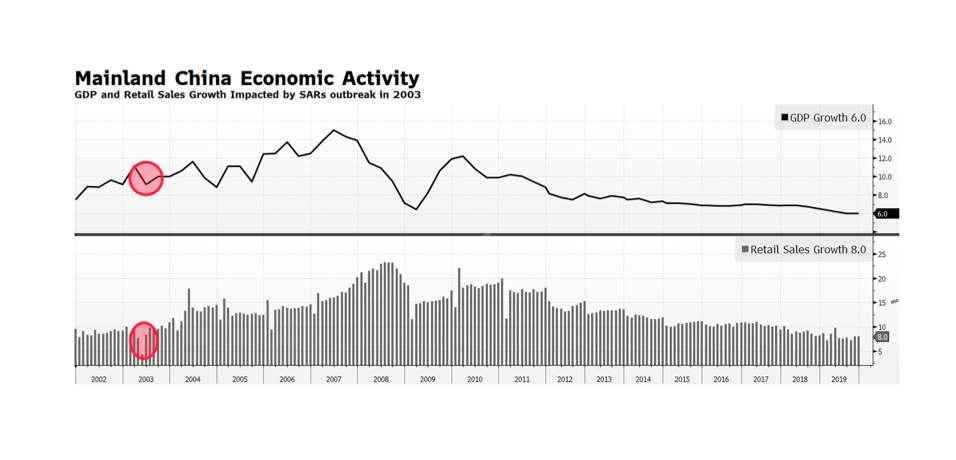
In the wake of Brexit and the risk of a pandemic it was time to take a diligent step back and compare current happenings with a bit of history. As the Coronavirus spreads within China and the WHO raises the specter of a global pandemic, investors have become concerned about the impact on the human condition and the global economy. During the SARs outbreak in 2003, Chinese economic activity was sharply impacted as GDP decelerated from 11.1% to 9.1% in the second quarter of 2003, and retail sales growth plummeted from 11.1% to 4.5% in the April to May months of that year. The SARS epidemic may, in contrast, look reasonably contained given what we don’t know about the Coronavirus. From a global economic standpoint, the Coronavirus impact is likely to be more severe given that China’s economy in 2003 represented a much smaller share of the world and it was much less consumer-oriented then. Chinese officials have limited travel and quarantined large segments of their population in order to limit the spread of the virus. Those actions will likely lead to stunted manufacturing output, and more importantly lower levels of consumption and retail sales which today represent a larger share of China’s economy. The impact of an even slower growing China will likely be a challenge for growth in the rest of the world. [chart courtesy of Bloomberg LP © 2020]
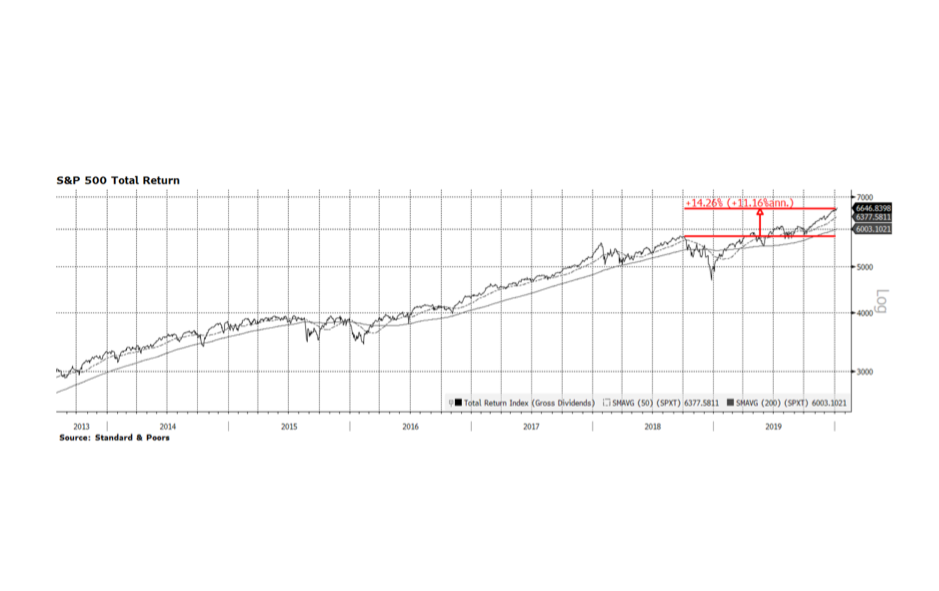
When you measure is everything. The major stock indices in the United States posted the strongest returns in recent years with the Nasdaq up 36.7%, Dow Jones Industrials up 25.3% and the S&P 500 (pictured below) 31.5% on a total return basis in the calendar year 2019. These results are undoubtedly impressive but are highly endpoint dependent. At the beginning of 2019 the equity market was reeling mainly due to the perception that the US Federal Reserve intended to pursue overly restrictive monetary policy only to announce quite the opposite at this time last year. The beginning of 2019 was a low point for US equity indices and the year ended with all-time record highs, producing very impressive calendar year returns. What we highlight on this week’s chart is the 14.26% total return (11.16% annualized) of the S&P 500 when measured from the September 2019 high prior to the fourth quarter US Fed-induced market rout. That return is historically strong but not as dramatic as measuring January to January would suggest.
For a bit of recent historical perspective, 2013 surpassed 2019 when the Nasdaq, Dow Jones and S&P 500 delivered total returns of 41.7%, 29.7%, and 33.1% respectively, followed by solid returns (all three indices posted 10%+ total returns) in 2014. [data courtesy S&P, chart courtesy Bloomberg LP © 2020]
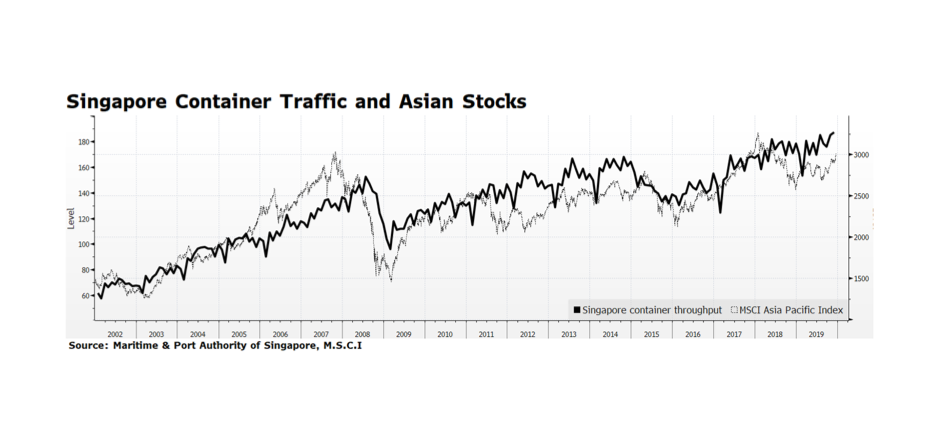
Nothing says holiday cheer like Asian exports. Actually, come to think of it that probably says a lot about holiday cheer depending on what is under your tree, menorah, or Festivus pole. Equities in Asia have been rallying since early this Fall but have underperformed global peers this year. But, on a positive note, container traffic in Singapore just hit an all-time high, which should be supportive of Asia’s bourses going forward. The reason container traffic is important is because it is a barometer of trade momentum in the region and Singapore is a strategic transfer point for goods. Its exports hover around 200% of GDP. Trade flows should continue to improve with Phase 1 of the US – China trade agreement and US House of Representatives passage of the US Mexico Canada Agreement (passage in the US Senate is likely). These developments are critical considering global economic activity is moderating. [chart courtesy Bloomberg LP © 2019 and Maritime & Port Authority of Singapore, MSCI]
As our esteemed Doug Wilde regularly points out, manufacturing isn’t the bellwether it once was of US economic output. We are a nation of users, not makers, now, and Retail is what matters. Unless you live in a well-stocked bunker, it is hard to avoid the focus on retail consumption this time of year. We will soon wrap up the big week of consumption capital in motion from “Black Friday” through “Small Business Saturday”, “Cyber Monday” and “Giving Tuesday”. That last one is of course about giving charity and not presents, but the relentless campaigns in person, by phone, and online have made it feel like one more consumption decision while rummaging through the wallet or purse.
From an investor’s point of view it is increasingly difficult to gauge retail activity because how people shop has shifted significantly in just the last few years. Reporters standing in shopping malls near the Santa villages breathlessly pointing to the crowds and bags does not tell the whole story. Even the viral mayhem videos at discount department stores when the throngs pummel each other to grab the BOGO Alexa-enabled combination teddy bear/espresso machine/lawnmower are entertaining yes, anecdotal mostly, informative not so much.
What we hear again and again is that online is killing traditional retail. For anyone who has walked this Earth for long enough there is actually a little bit of schadenfreude since today’s “traditional retail” killed local merchants and main streets a generation or two previously. We do agree that online shopping has been the weapon of choice to kill off department stores and shopping malls, but this is not some great innovation or revelation. Us oldsters remember Sears, JC Penney, Montgomery Ward and other catalogs where almost anything under the sun was a phone call or mail order away. For families that lived out in the boondocks, that was the only way to access a lot of products, not much different from today where significant portions of the population are not close to “traditional retail”.
So why do we care as portfolio managers? First, we do want to obtain a clean look at the American consumer as an indicator of the health of our economy. Second, consumption patterns tell us a lot about where growth can be found, and of course has a direct connection not just to the growth of equities of companies all along various supply chains, but to the growth of debt to finance making, selling and consuming. Employment patterns are also closely tied to consumption patterns, particularly during the holiday season.
We see the mix of retail venues changing. Other than automobiles, where the traditional distribution structure is consolidating but not really changing despite Elon Musk’s best efforts, with whom and when people shop is shifting. We can now do a lot of financial damage with an iPhone while wearing footy pajamas and binging The Office. And even through that little 5.5” window, the process of consumption is changing. An influencer on Instagram can hype a product, provide an in-app link, and voila, you are purchasing it with a couple finger taps. The reality now, as we have written before, is that America is simply over-retailed. There are too many places and ways to buy the same products. A lot of the factors that differentiated channels before have dissolved. Price differences have been arbitraged away because of comprehensive access to competitive pricing information. The quest for instant gratification can be satisfied as easily by clicking and waiting by the front door as heading to the mall. Expertise and consultation are more likely to be found online than with the teenaged clerk who is just counting the hours until the shift is over. And when those teenagers do get off work, they aren’t going to roam the malls and food courts themselves to socialize and maybe spend. They may be going home and meeting up with friends through MMO games and even spending those earned dollars leveling up their avatars with swag or new capabilities. How do you measure that in old retail terms?
If people are buying directly from manufacturers’ branded captive websites and catalogs, or through social media, or through major online portals, and of course through bricks-and-mortar stores, how do we get anything resembling a complete much less accurate picture of retail consumption? Some of that insight can come from looking elsewhere in the supply chain. We can consider raw materials, packaging, shipping and logistics, royalties and licensing fees. We can look at volumes through final mile services like UPS and Fedex. We can look at sales tax receipts (although the patchwork of rules around interstate tax collection means this gets you a massive undercount). We can look at hiring, particularly seasonal hiring, which is moving away from retail counters and towards fulfillment centers. We can also look at aggregate transactional data from consumer credit and newer virtualized and peer-to-peer payment methods.
The big issue is that a lot of this data is scattered, not gathered and reported in a timely fashion, and has to be collated and interpreted. Joe the Weatherman reporting from the mall about how long the lines are and how full the bags is not going to do it. We will also look at but retain healthy skepticism about reports from trade groups like the National Retail Federation, which exists to promote the interests of its members. Useful information, but it has to be viewed in the context of its mission and stakeholders. That leaves us the government statisticians, who don’t necessarily have an axe to grind, but the data is lagged and the coverage has not always kept up well with how the retail landscape has changed. The US Census Bureau will be releasing the November 2019 Advance Monthly Retail report on December 13th.
Right now we see the US consumer as reasonably robust. The change in how consumption is taking place means looking elsewhere in the markets to participate in that growth. For instance, instead of REITs that own shopping malls, favor REITs that own warehouses. Look for themes like electronic payments. And of course, trends toward local, organic, fair trade, reclaimed, and other sustainability themes are driving retail flows and even countering the race to the bottom in pricing.
According to the New York Times, more than 90,000 packages a day go missing daily in New York City, and 1.7 million daily nationally. That is clearly a problem on a massive scale. But if that much can go missing or be stolen daily and not break the system or materially drive up costs, the scale of consumption outside of traditional retail store fronts is extraordinary. Maybe this number more than any other is the bellwether indicator we need to watch.
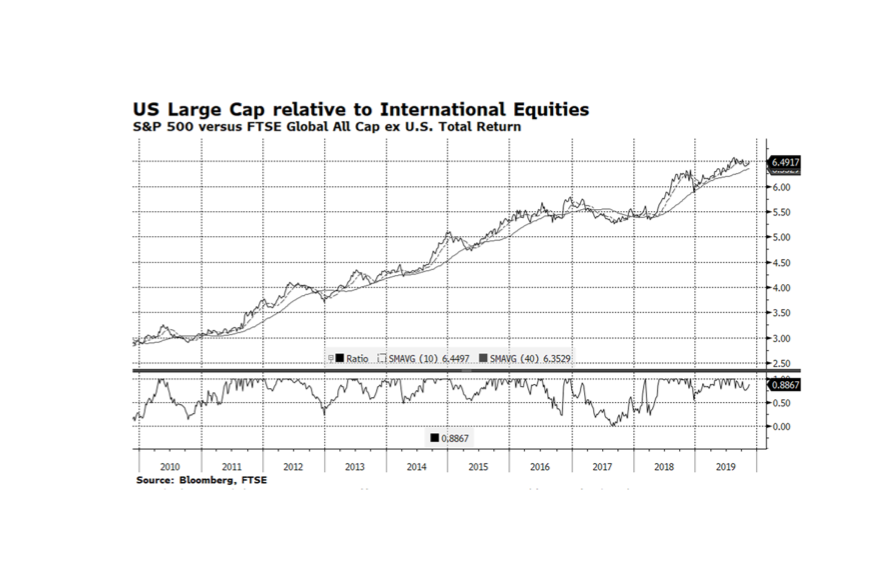
Large Cap stocks in the United States have outperformed the rest of the world for the better part of the past ten years largely because of superior demographic, economic and corporate conditions in America. However, there have been several periods this decade when international bourses have gained ground on America and that has been the case since mid-August this year. While US companies have tended to exhibit robust fundamentals compared to their international rivals, stock market valuations favor international equities. Can the rest of the world continue to outpace the US? We continue to favor American stocks and bonds because economic conditions abroad continue to be challenging. Eurozone economic activity is barely expanding, although the German economy did surprise on the positive side (thus narrowly avoiding a recession) and Chinese GDP growth may be slowing more than expected. The headwinds international markets face may prove to be too much to overcome from a relative performance standpoint. [chart courtesy Bloomberg LP (c) 2019]
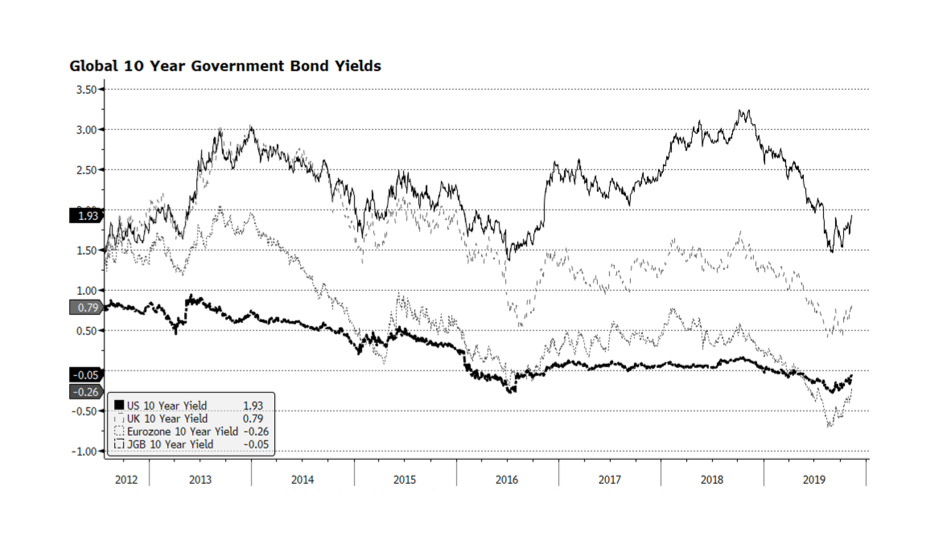
The global rally in stocks and key US equity indices hitting all-time highs are again garnering the majority of the financial press’ collective attention. We however prefer to focus on government bond markets. Long-term interest rates may have bottomed towards the end of this past summer. 10-year government bond yields in key developed economies are on the upswing and may even have positive readings in Japan and the Eurozone before year end. We find the upward interest rate trajectory interesting in the context of the US Federal Reserve’s recent decision to lower its target rate. It is encouraging that yields are rising together which may be a signal that economic conditions across the globe are stabilizing and safe haven asset prices are falling. [chart courtesy Bloomberg LP © 2019]