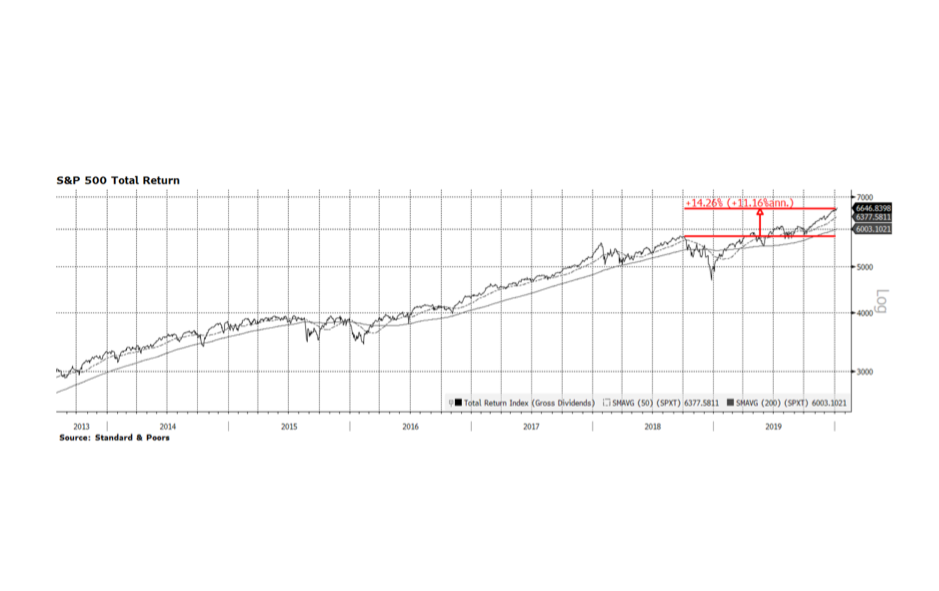
When you measure is everything. The major stock indices in the United States posted the strongest returns in recent years with the Nasdaq up 36.7%, Dow Jones Industrials up 25.3% and the S&P 500 (pictured below) 31.5% on a total return basis in the calendar year 2019. These results are undoubtedly impressive but are highly endpoint dependent. At the beginning of 2019 the equity market was reeling mainly due to the perception that the US Federal Reserve intended to pursue overly restrictive monetary policy only to announce quite the opposite at this time last year. The beginning of 2019 was a low point for US equity indices and the year ended with all-time record highs, producing very impressive calendar year returns. What we highlight on this week’s chart is the 14.26% total return (11.16% annualized) of the S&P 500 when measured from the September 2019 high prior to the fourth quarter US Fed-induced market rout. That return is historically strong but not as dramatic as measuring January to January would suggest.
For a bit of recent historical perspective, 2013 surpassed 2019 when the Nasdaq, Dow Jones and S&P 500 delivered total returns of 41.7%, 29.7%, and 33.1% respectively, followed by solid returns (all three indices posted 10%+ total returns) in 2014. [data courtesy S&P, chart courtesy Bloomberg LP © 2020]