Wilde Capital Management is proud to have been part of the Force for Good steering group and the team that prepared the new report, “Capital as a Force for Good: Global Finance Industry Leaders Transforming Capitalism for a Sustainable Future”, which was launched at the ‘Global Leadership in the 21st Century’ conference organized by the United Nations, Geneva and the World Academy of Art and Science, in support of the United Nations’ 2030 Agenda for Sustainable Development.
63 leading institutions in the global finance industry, representing over US$100 trillion, and nearly 30% of the world’s financial assets, are pointing the way for the industry as a whole to respond to major global challenges including climate change, financial inclusion and inequality.
The new report documents and analyzes their activity in terms of environmental, social and governance (ESG) polices, sustainability programs, and stakeholder engagement, whose cumululatve impact determines how they can be a “force for good” in the world. Taken together, these can have significant impact on driving sustainability in the world, both directly and and indirectly through changes in the way capital is deployed, driving up the cost for those that damage it.
As the sun sets on 2020, we want to extend our gratitude and appreciation for our amazing clients, partners, vendors, friends and colleagues. It was quite a ride, and we are thankful to have taken it with you. We will take a break from the weekly charts to leave room for both celebration and contemplation about the challenges and opportunities in front of all of us in the new year. Wishing everyone a terrific holiday season, and a happy, HEALTHY, and prosperous new year. The COTW will return in January!
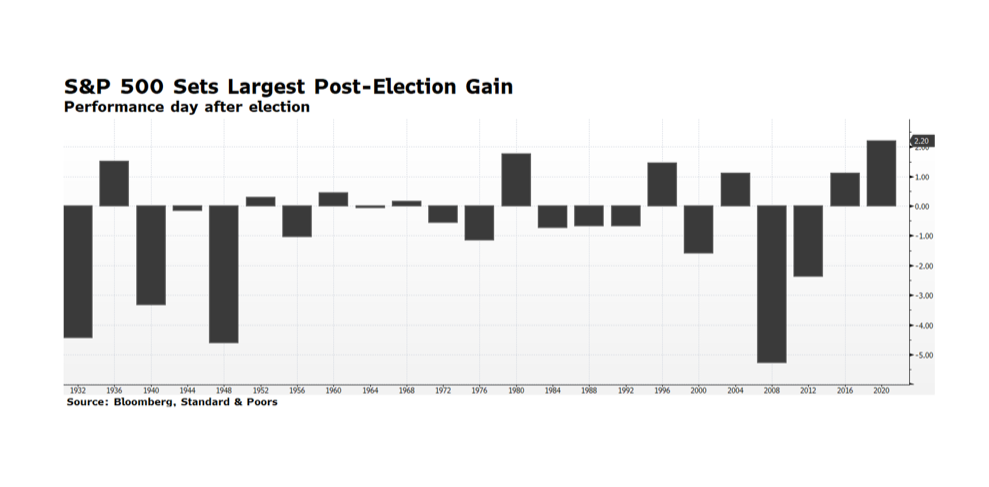
US equity markets have rallied strongly in the days following the national elections. According to Bloomberg, the S&P 500 delivered its largest day-after-election gain in history — 2.2%. This may seem perplexing because the outcome of the presidential election and even some congressional seats are yet to be finalized and markets generally fear uncertainty. It appears that Democrats will maintain control of the House of Representatives and the Senate will remain under Republican leadership while both majorities will likely be less dominant. The Electoral College does not cast its 538 votes until the first Monday following the second Wednesday in December (Dec. 14, 2020), and a lot of work is yet to be done and lawsuits to be filed in battle ground states between now and then. In light of the political uncertainty the positive tone in US equity markets can be explained by several factors.
First, the balance in Congress is likely to lead to no drastic change in US tax rates as any proposed increase would stall in the Senate. The same would likely result from any major proposed change to US energy policy. Markets generally respond favorably to policy certainty, or at least stability. Second, another round of stimulus will likely be delivered at some point before the end of the year. This tranche of spending or relief will likely be more targeted to the areas of the economy most impacted by the deadly effects of COVID-19. Meanwhile the Fed will remain accommodative. Markets thrive with generous stimulus. Third, the US economy is rapidly recovering. As many expected, the US economy rebounded strongly in the third quarter, exceeding economists’ forecasts. The BEA reported GDP grew at a 33.1% annualized rate while the consensus estimates stood at 32.0% prior to the announcement. Finally, the labor market continues to improve with October employment posted as a +638,000 change in payrolls and unemployment falling to 6.9%, both better than consensus expectations.
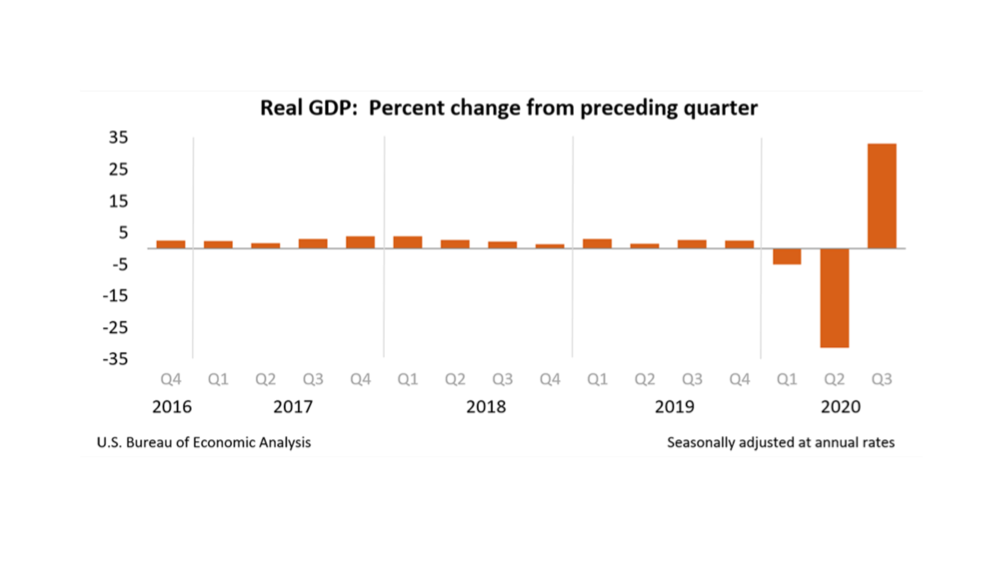
As many expected, the US economy rebounded strongly in the third quarter exceeding economists’ forecasts. The BEA reported GDP grew at a 33.1% annualized rate while the consensus estimates stood at 32.0% prior to the announcement. The rebound is quite welcomed in the wake of Q1 and Q2 contractions of 5.0% and 31.4% respectively. Strength was delivered across nearly all key sectors of the economy with the exception of Government Spending. Personal Consumption Expenditures, the largest segment of the economy, grew 40.7% (annualized) in Q3, highlighted by an 82.2% advance in Durable Goods. Gross Domestic Private Investment expanded at an 83% clip. Exports and Imports also rebounded impressively. The recovery appears to be underway and the recent report is headline grabbing, but the level of GDP is still some 2.8% lower than at this point last year. The key to the trajectory going forward is in state and local lock downs which are lifted or reinstituted as confirmed COVID-19 cases are peaking across the nation. This introduces major uncertainty which, along with the lack of additional stimulus spending, have caused capital markets to become more volatile over the past several trading days. Stay tuned. We will.
“Global warming: the long-term heating of Earth’s climate system… due to human activities, primarily the burning of fossil fuels, which increases heat-trapping greenhouse gas levels in Earth’s atmosphere,” (Shaftel, 2020). The term coined decades ago has gained momentum in not only scientific communities and environmental organizations, but political campaigns and industry corporate governance policies around the globe. From polar ice melting and sea levels rising to extreme weather events, our changing climate has far reaching and compounding effects on the environment and ecosystems, our economies and industries, and our global food supply. One of the direct effects of climate change and global warming is ocean acidification.
To examine the process of ocean acidification and its impacts on human life, recall an adolescent science lesson on pH and water chemistry. The pH scale runs from 0-14, with 7 being neutral. Higher than 7 represents a basic or “alkaline” pH and lower than 7 represents an acidic concentration. For reference, household vinegar, an acidic liquid, has an average pH of 2.5, while tap water has an average pH of 7.5. The ocean’s current pH is approximately 8.1, which is basic (NOAA, 2020). How does the ocean’s pH tie into global warming and climate change?
The ocean naturally absorbs roughly 30% of the carbon dioxide that is released into the atmosphere. When seawater and carbon dioxide combine, carbonic acid is produced, lowering the pH of the ocean and increasing the acidity. As levels of carbon dioxide increase due to human activity (burning of fossil fuels, land-use change and deforestation, agricultural industries) the amount of CO2 absorbed by the ocean also increases. Plainly speaking, the more CO2 we produce and release into the atmosphere, the more acidic our oceans become. Since the Industrial Revolution in the 1700’s, increases in CO2 have resulted in a 30% increase in ocean acidity (NOAA, 2020). This present acidification process is occurring ten times faster than any previous changes over the last 300 million years (IUCN, 2017). The rapid acceleration of CO2 production significantly jeopardizes the ability of ecosystems to effectively adapt to the changes in ocean chemistry.
Increased ocean acidity especially affects organisms with calcium carbonate shells or skeletons including shellfish like coral, oysters, crab, and lobster. A recent study performed by the National Oceanic and Atmospheric Administration on the pteropod, a small sea snail integral to the ocean food chain, showed that the levels of ocean pH projected for year 2100 dissolve the organism’s shell within just 45 days. Furthermore, researchers have already discovered severe shell dissolution in pteropods naturally found in the Southern (Antarctic) Ocean, indicating the process’ rapid progression (NOAA, 2020). The pteropod snail is a major food source affecting members of the food chain from krill and fish to whales and seals. When we consider how each organism is interconnected in the food web, the loss of one species creates a cascading effect.
Unfortunately, the consequences do not stop there. Increased acidity has also been linked to a disturbance in scent transmission, inhibiting species from detecting predators and locating suitable habitats (NOAA, 2020). Acidification has also been observed to affect sound transmission, reducing sound absorption and increasing the ocean’s ambient noise (OAN). Increases in OAN can impair marine animals’ hearing and communication, increase stress and lower their immune systems, and even cause brain hemorrhaging or death in severe cases (Gazioğlu, 2015).
High Level Impacts
In 2018, the global fishing and seafood sector represented a USD 164 billion international trade industry employing 59.5 million people. 88% of the 179 billion tonnes of total fish produced in 2018 was for direct human consumption. Fish and fish products supply approximately 3.3 billion people with nearly 20 percent of their average per capita intake of animal protein. Furthermore, seafood provides many crucial nutrients to the human diet including long chain Omega-3 fats, iodine, vitamin D, iron, calcium, zinc, and other minerals. With key species like the pteropod in jeopardy, the entire seafood industry risks significant threat, exacerbating global hunger and malnutrition (FOA, 2020). Dying coral systems lack the ability to effectively buffer coastal communities from storm waves and erosion, and leave those communities to suffer consequences to tourism and commercial business (IUCN, 2017). Profits, careers, economies, biodiversity, ecosystem structure, shoreline integrity, and global food supply are all threatened if ocean acidification continues to accelerate due to increased CO2 production.
As managers of sustainable and responsible investment portfolios, our passion lies not only in providing ethically sourced returns for our clients, but in supporting positive impact-driven companies and communities. Conscious investing is achieved through selective avoidance of institutions that harm ecosystems or using the allocation of capital as a lever to change those institutions, in conjunction with focusing on institutions that provide regenerative and resourceful solutions to humanities’ needs.
Gazioğlu, C., Müftüoğlu, A. E., Demir, V., Aksu, A., & Okutan, V. (2015). Connection between Ocean Acidification and Sound Propagation. International Journal of Environment and Geoinformatics, 2(2), 16–26. https://doi.org/10.30897/ijegeo.303538
We are pleased to present the last stage of our updates and improvements to our monthly newsletter. You will now find a greater emphasis not just on our views of where we just were, but on where we are and where we are headed, with a deeper discussion of the episodic and structural risks we see driving our investment decisions. We also now include a topical discussion of ESG considerations that have emerged as priorities over the period covered by the newsletter.
As always, you will find our newsletters in the Library, available to all.
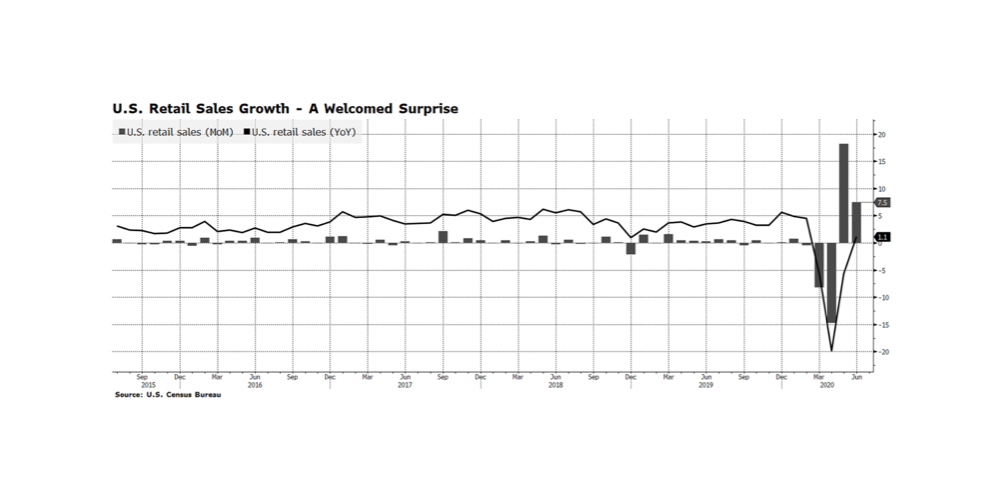
On Thursday, July 16th, the US Census Bureau released Retail Sales figures and month-over-month growth registered a nice surprise — 7.5%, well above the consensus estimate of 5.5%. The prior month’s figures were also revised upward. We see this as an obvious reflection of the reopening of the US economy and pent up demand. But, we don’t read much into the positive monthly gain versus the consensus estimate because economists have never had to forecast under conditions that can be considered “lock-down uncertainty”. What we do find encouraging and more interesting is that the reported annual growth rate was 1.1%. At this time last year the US economy was on firm footing, and yet Retail Sales are modestly above those levels today. While the trajectory of sales growth is a relief, we would not be surprised to see some sluggishness emerge as we collectively digest the flurry of initial purchasing pre-quarantine and new virus spikes elicit further lockdown measures. [chart courtesy US Census Bureau, Bloomberg LP (c) 2020]
Every member of an eco-system, from vegetation to predator species, plays an integral role in the sustainability of that system. When one player is removed from the hierarchy, whether by result of climate change, pollution, human development, or natural occurrences, the effects are cascading. An often overlooked and yet essential vulnerable group of species is pollinators. Although bees and fruit bats are not the poster children for endangered species like tigers and elephants, their role in pollination facilitates an ecological process critical for the reproduction of wild flora and agricultural crops.
(c) 2020 P. Sorgi
According to the U.S. Department of Agriculture, more than 150 crop species in the United States, including blueberries, tomatoes, apples, bananas, and peaches, rely on pollinators annually. Alfalfa and other grain crops necessary to sustain livestock also rely upon pollination. Furthermore, more than half of the world’s diet of fats and oils are produced from animal-pollinated plants (sunflowers, almonds, canola, avocados). Honeybees alone are responsible for pollinating $15 billion in crops for the U.S. economy each year (Main, 2020). Plainly speaking, without pollinators, the globe’s future food security collapses.
Without pollinators, you can drop the dinner table conversation because there quite literally won’t be a dinner
So, where does the issue reside? According to Penn State University’s Center for Pollinator Research, since 2006, the honeybee population in the United States has declined 30-42 percent each year largely due to the impacts of climate change, habitat loss, and toxic pesticide use. Of the 65 species of flying foxes (fruit bats), 31 are threatened with global extinction (Vincenot, 2017). Protecting species of pollinators is not just the “right thing” to do; it’s compulsory for human existence.
As managers of sustainable and responsible investment portfolios, our passion lies not only in providing ethically sourced returns for our clients, but in supporting positive impact-driven organizations. Conscious investing is achieved through avoidance of institutions that harm ecosystems, in conjunction with focus on institutions that provide regenerative and resourceful solutions. [artwork (c) 2020 P. Sorgi]
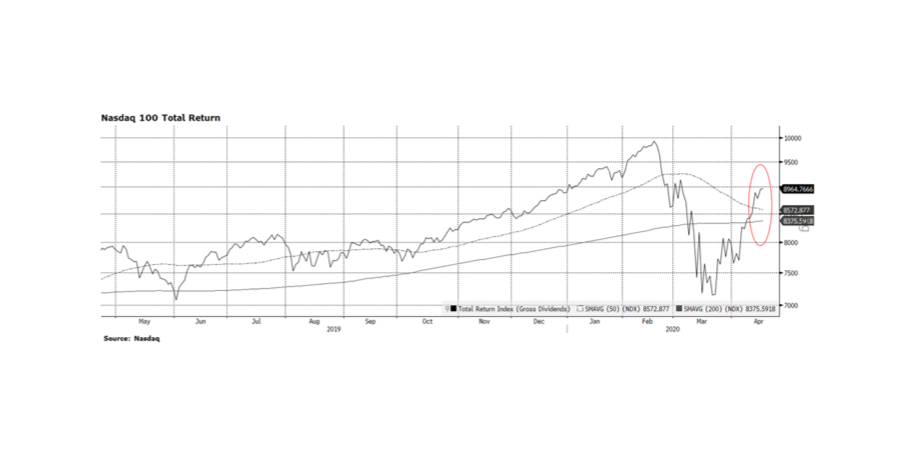
We continue to see encouraging signs in the US stock market as the three main indexes, the Dow, S&P 500 and the NASDAQ Composite have come off of their recent lows on March 23 and are making higher highs and higher lows – a key bullish technical pattern. Wednesday was interesting because the S&P 500 closed at a higher low even though it fell 2.2% for the day, and Thursday we had a modest follow through gain of 1/2 of a percent or so. The Nasdaq Composite was even more consequential because we continue to see higher highs after higher lows as well. And, in this week’s chart, the Nasdaq 100, laden with many of the US’ most innovative companies, is now positive in 2020 (still below its Feb peak) and at levels above its long-term trend lines.