WCM Chart of the Week for September 6, 2019. Large Cap US stocks continue to outperform with the S&P 500 total return reaching 20.7% YTD through (September 5, 2019). This end of the US equity market, in particular, the Technology sector, contains the world’s strongest performers so far in 2019. US Small Cap equities however have lagged considerably, only gaining 13.2% over the same time period while global stocks as measured by the FTSE Global All Cap Index have advanced 15.8%.
Economic trends in the US are much more favorable than in other key regions such as Europe and Asia. US Small Cap companies generally are more domestically oriented while Large US companies earn significant amount of revenue overseas. Intuitively, the global environment should favor US Small Caps but that has not been the case. The key might be the low interest rate environment enabling large companies to raise substantial amounts of debt through the corporate bond market while smaller companies are more dependent on regional bank financing. Another key factor explaining the performance disparity between Large and Small Cap stocks may be sector representation. The financial sector of the S&P 500 represents roughly 12% of the index while the Russell 2000 has about 17%. The financial sector has been a laggard overall and a small financial service company’s revenue is generally more dependent on lending which tends to struggle in low interest rate environments.
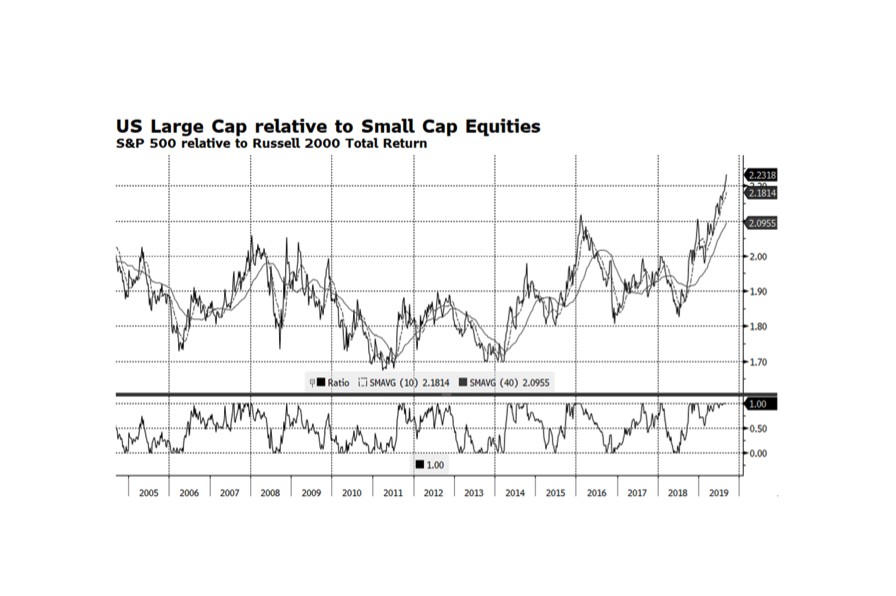
This week’s chart shows the total return relationship of US Large relative to Small Cap Equities. Large Cap stocks are trading at their highest levels relative to Small Caps in at least the past 15 years and are clearly extended. This is highly unusual but may persist at least until the US Federal Reserve ends its current rate cutting path and other monetary stimulus activities. [chart courtesy of Bloomberg LP (c)2019]