Category: Federal Reserve (Page 2 of 4)

WCM Chart of the Week — Summer-End 2021

This will be our last chart before Labor Day. The US Federal Reserve’s preferred measure of inflation, the YoY rate of change in the Personal Consumption Expenditure Index (PCE), has been exceeding its 2% target rate since April making investors concerned that we may be approaching a monetary tightening cycle. That fear was escalated by this week’s release of the Fed’s July 28-29th meeting minutes that indicated they may begin to wind down the current $120 billion monthly asset purchases by the end of this year or the beginning of 2022. The Fed has expressed its view that current inflation trends are transitory and are likely due to temporary factors such as supply chain bottlenecks and a strong rebound in demand from last year’s lull in consumption. As of June 30th, the current annual rate of the PCE was 3.54%, well above the Fed’s target, but in June 2020 the reading was 1.13%. Since the Fall of 2008 during the Financial Crisis, the PCE has been stubbornly below 2%, averaging 1.59%. Over that period of nearly 13 years, the PCE has been over 2% only in Q1 2012 and for most of 2018.  Inflation has been undershooting for a long period leaving aggregate price levels far below the Fed’s ideal. This suggests to us that the Fed will likely tolerate inflation until the PCE normalizes.

WCM Chart of the Week for August 9, 2021

Investment Grade and High Yield bond spreads have been edging higher since reaching their tightest levels ever at the end of last quarter. Admittedly, the spread widening may have more to do with the decline in Treasury yields since June 30th than an indication of any deterioration in the credit markets. What is interesting to us is that this has been occurring while broad stock market indices in the US and Europe are hitting all-time highs. Equity market valuations are full, particularly in the US, but according to Bloomberg consensus earnings are expected to grow by 11.8% over the next 12 months, putting the forward PE ratio of the S&P 500 at 20.3x, lofty yet not extreme. Our sense is that, barring a major surprise or a misstep by the US Fed, the positive tone in equities in the Western world will continue. The outcome of the Fed’s September meeting will be highly scrutinized but the likelihood that they will surprise markets is low. [chart courtesy Bloomberg LP © 2021]

WCM Chart of the Week for June 28, 2021

Since 2013, the NY Federal Reserve has been conducting a consumer survey focused on expectations for rental housing costs in the year ahead. The survey participants expect housing rental costs to soar a record 9.7% in the next 12 months, which is a major increase from the average of about 5.6% since the survey began nearly eight years ago. Survey data and other “soft” indicators, while useful, tend to lag hard data. Granted, there are also widespread reports of labor shortages and lack of transportation, but that is most likely a temporary condition. Taking this and other signals into account, we would be more concerned about inflation becoming a more permanent problem if the bond market was behaving as if the economy was moving towards that. But, the benchmark 10-year US Treasury bond yield, now standing at 1.47%, has descended from its peak of 1.74% on March 31st. Also, some key commodity prices are declining — the lumber crack spread (cited by WCM on June 14th) has fallen over 30% in two weeks. For now, we view these pockets of inflation as more of an adjustment from pandemic-created economic readings rather than a permanent progression towards higher consumer price levels. [chart courtesy NY Fed and Bloomberg LP © 2021]

WCM ESG Week — Theme 2: Banking the Un(der)banked

Deposits in the United States are insured by one of two federal agencies: the Federal Deposit Insurance Corporation or the National Credit Union Administration. In the first quarter of 2021, the Federal Deposit Insurance Corporation reported 4,978 current FDIC-insured commercial banking and savings institutions in the United States providing banking and credit services. In addition, the FDIC acts as the federal supervisor to another 3,209 state-chartered banks and savings institutions in the United States that are not members of the Federal Reserve system. These FDIC-insured and supervised institutions serviced in total over $22 trillion in assets as of quarter one 2021 (FDIC, 2021). In the same time frame, the NCUA reported a total of 5,068 federally insured credit unions servicing $1.95 trillion in assets to over 125 million customers (NCUA, 2021). So, what does it mean to be underbanked or unbanked in one of the richest and most prosperous countries in the world?

Every two years since 2009, the FDIC conducts a household survey in cooperation with the U.S. Census Bureau on the use of banking and financial services in the United States. The survey collects responses from approximately 33,000 households to analyze trends in the financial services industry by geographical, demographic, and economic factors.  The last survey, conducted in 2019, estimated 5.4% of U.S. households were unbanked, meaning that no household member had a checking or savings account at a bank or credit union. This percentage represents approximately 7.1 million households.  Unbanked rates were higher amongst lower-income, less-educated, and Black, Hispanic, and American Indian or Alaska Native households. Among households reported as unbanked, 48.9% cited the reason for not having an account as, “don’t have enough money to meet the minimum balance requirements” (FDIC, 2019). Furthermore, according to a survey conducted in 2019 by the Federal Reserve, an additional 16% of adults are underbanked in the United States, meaning they have a bank account but still use other alternative financial service products such as money orders or pawn shop loans due to lack of affordability or access to traditional and more secure products (Federal Reserve, 2017).

On a global scale, 1.7 billion adults are reported as unbanked in 2017, with China and India accounting for almost 325 million unbanked individuals alone. Women disproportionally represent 56 percent of all unbanked individuals globally (Findex, 2017). Lack of access to traditional banking services hinders individuals’ ability to build emergency funding, execute financial transactions such as paying bills or cashing checks, and results in a lack of access to credit.

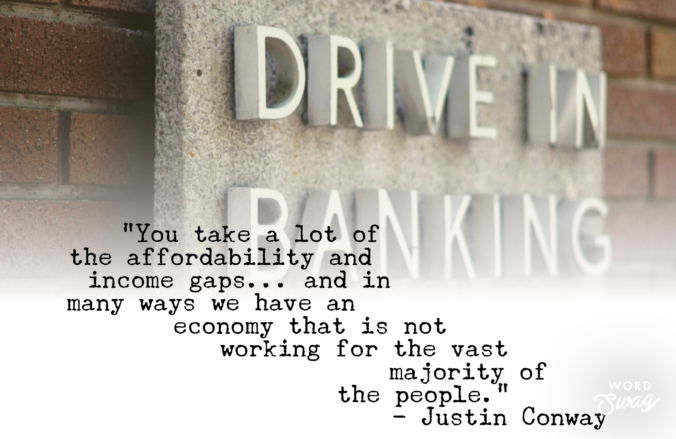
Tune into our Wilde Capital Management ESG Week podcast Day 2: Banking the Un(der)banked where we explore financial services trends with Justin Conway, Vice President of Investment Partnerships at Calvert Impact Capital.

https://www.federalreserve.gov/publications/2019-economic-well-being-of-us-households-in-2018-banking-and-credit.htm

https://globalfindex.worldbank.org/sites/globalfindex/files/chapters/2017%20Findex%20full%20report_chapter2.pdf

https://www.ncua.gov/files/publications/analysis/industry-at-a-glance-march-2021.pdf

https://www.ncua.gov/files/publications/analysis/industry-at-a-glance-march-2021.pdf

https://www.fdic.gov/analysis/quarterly-banking-profile/statistics-at-a-glance/2021mar/industry.pdf

WCM Chart of the Week for May 25, 2021

The US Fed and European Central Bank (ECB) continue to pursue aggressive quantitative easing while the two dominant Asian central banks, the Bank of Japan and the People’s Bank of China, have slowed their securities purchases so far this year. The ECB’s activity is of particular interest, not only because of the size of the balance sheet ($9.2T, €7.6T), but the pace that it has expanded over the course of the past year. The ECB’s monetary support continues at a critical time as the EU economy appears to be emerging from the pandemic-induced slump. Lock downs are slowly being lifted and infection rates are plunging from the March and April spikes. Another promising (gradual) trend emerging is in sovereign interest rates in the region, which appears to be an indication of stronger economic activity in the months ahead. [chart courtesy Bloomberg LP (c) 2021]

WCM Chart of the Week for May 17, 2021

According to the US Federal Reserve, growth in the money supply, widely described as M2, peaked at nearly 27% at February’s month end reading and as of March it registered a 24% annual clip. To place those figures in context, the pre-pandemic average annual growth rate of M2 over the preceding 20 years [February 2000 – February 2020] was 6.1% according to Fed data. The previous peaks in M2 growth never surpassed 10.3%. Put another way, the entire US money supply, from the birth of our nation to now, expanded by around 25% in the past year alone.

This tremendous amount of additional liquidity is tied to quantitative easing and the numerous fiscal stimulus plans that have delivered direct payments to individuals and families that, for the most part, landed in bank deposit accounts. Commercial Bank Liabilities, the equivalent of consumer deposits, have swelled some 26% since the beginning of the pandemic, indicating that stimulus recipients have fortified savings as opposed to increasing spending. The good news is that consumers are in better shape than they have been in several years. The bad news, if it can be considered that way, is that there is likely pent-up demand that could ultimately fuel inflationary concerns.

The most recent annual headline inflation figure (CPI) reported by the US Bureau of Labor Statistics for April was 4.2%, well above the consensus of 3.6% and over two times the Fed’s target rate. Our main concern is whether the recent upward trend in prices is reflationary or a more enduring inflationary trend. The Fed has stated that it considers current price conditions to be “transitory” and thus falling into the reflationary category. [chart courtesy Bloomberg LP © 2021]

WCM Chart of the Week for May 11, 2021

The US Census Bureau’s latest survey of retail sales will be reported on May 14th. The Bloomberg survey of economists’ average forecast is for a 1.0% monthly gain, adding to March’s torrid 27.9% annual pace. March’s level of over $614 billion in purchases is nearly 17% higher than the pre-pandemic level of $525.8 billion of February 2020. Consumption, the most dominant portion of the US economy, is clearly rebounding and could further stoke inflationary concerns. This is occurring as hundreds of billions of US fiscal stimulus dollars have yet to be fully deployed with potentially more on the way on top of elevated commodity prices, shortages in building materials and the labor force far from full employment levels. The Fed remains committed to QE, in effect managing the entire yield curve, and has publicly stated that it will tolerate higher inflation. But for how long? Market pressures may force the Fed to act sooner than they currently plan and that could be a major shock to the system. [chart courtesy Bloomberg LP © 2021]

WCM Chart of the Week for April 26, 2021

Bloomberg’s most recent update on economists’ expectations for the US Federal Reserve to begin tapering its asset purchases found that 45% of those surveyed believe the Fed balance sheet will begin to contract in Q4 of 2021. This is important because expectations are moving forward, as the previous month survey (March) had only 27% of respondents foreseeing the Fed tapering beginning in Q4 2021. The main difference between the April and March reports was a shift from Q1 2022 to Q4 2021. The Fed is not expected to alter policy in this week’s FOMC policy statement release and will likely maintain highly accommodative monetary conditions. But, the shift in expectations may turn out to be critical for capital markets. Benign Fed policy has been one of the main factors supporting asset prices over decades and especially in recent years. The shift in expectations may become a headwind for risk assets in the months ahead.

WCM Chart of the Week for April 12, 2021

According to Citigroup’s Earnings Revision Indices, Eurozone earnings are far outpacing the rest of the world, and equity prices are gaining on a relative basis as well. Year-to-date through April 12th, Eurozone shares still trail the S&P 500 total return in US dollar terms 7.2% to 10.2%. Equity investors may be signaling that even in the midst of reimplemented economic shutdowns and virus spikes, the worst may be over on the Continent and more prosperous conditions are on the horizon. There are also reasons to be optimistic about the region’s stocks — they trade at favorable valuations compared to US equities and the ECB is continuing to be highly accommodative making fixed income alternatives unattractive. If Eurozone equities can continue to rally and broaden the global advance of stocks it would likely provide a boost of confidence for investors worldwide. [chart courtesy Bloomberg LP, Citigroup © 2021]

WCM Chart of the Week for March 1, 2021

Equity markets around the globe were on edge as February came to a close. The technology-laden NASDAQ fell nearly 7% from an all-time high on February 12th. The weakness in equity prices came despite very accommodative comments from US Federal Reserve Chairman Jerome Powell during his scheduled two-day Congressional testimony last week. Equity markets became unnerved as government bond yields began to rise at an accelerated pace in the US, Eurozone and particularly the UK. Benchmark interest rates have been rising since the beginning of this year and US interest rates have been climbing since last Summer signaling expectations of improving economic conditions in the months ahead. As long as the rate environment increases gradually, gains can continue in equity markets. But, as we witnessed over the past few weeks, a steep ascent in market interest rates will have an expected adverse impact on risk assets. [chart courtesy Bloomberg LP (c) 2021]

« Older posts Newer posts »