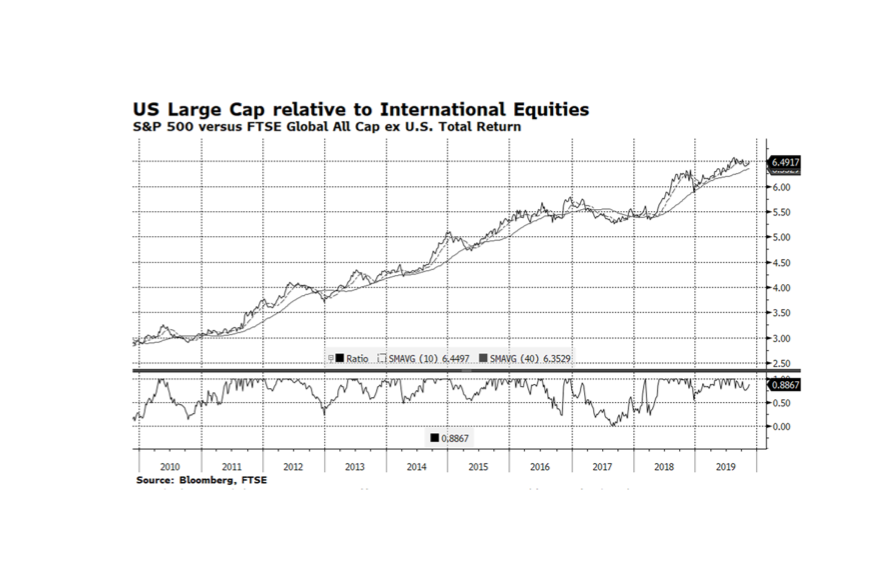
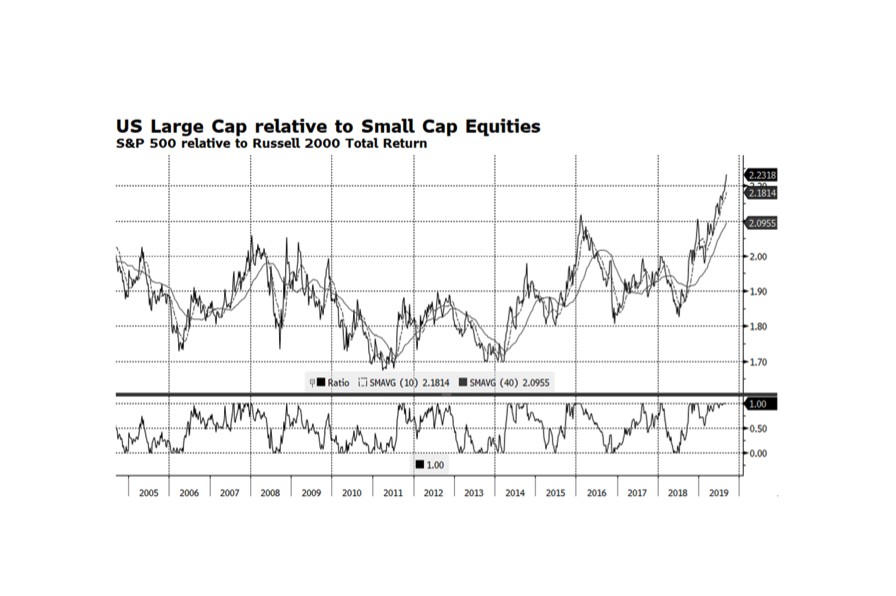
Category: Equities (Page 4 of 4)

WCM Chart of the Week for November 1, 2019

Growth stocks in the US have outperformed value stocks for the better part of the past three years with the exception of the US Fed induced sell off at the end of last year. However, since mid-August value stocks have outpaced growth stocks by a considerable amount rallying nearly 8% versus 3.5% according to S&P 500 Value and Growth indices.  If value stocks can continue to outperform or even keep pace with the overall market, we would view this as a positive development because it could mean that broader participation is developing.  That is important because the S&P 500’s largest the sector, Information Technology, continues to outperform, powering the market higher.  We find this interesting because usually technology stocks outperform with growth leading value. [chart courtesy Bloomberg LP © 2019]

WCM Chart of the Week for September 27, 2019

On the last day of Climate Week, we shift our focus from where we started with bonds to conclude with global equities. One of the tired old tropes that gets trotted out for people who have not looked at the data is that ESG-oriented strategies are structurally disadvantaged and destined to underperform. Of course, every strategy follows its own course based on benchmarks, PM decisionmaking, trading effectiveness, and a variety of other factors. But if we take the discretionary elements out and just focus on index comparisons, we do not find any persistent lag or advantage. Yes, performance varies somewhat in the short term.

Sometimes ESG leads, sometimes it lags. Over market cycles though, these small variations sort themselves out and you end up in the same place. MSCI, one of the world’s preeminent index authorities, has maintained an ESG Leaders series of equity indices that start in 2007.  According to Bloomberg, since the inception of the global ESG Leaders Index (on September 28, 2007) through September 26, 2019, the ESG index total return is 72.4% compare to 71.3% for the global equity index, or annualized total returns of 4.64% and 4.59%, respectively. This week’s chart shows this relationship graphically and there do appear to be cycles of outperformance as well as underperformance of the ESG index.  However, this is considerably exaggerated by the scale of the chart as the differences measure in fractions of basis points.

WCM Chart of the Week for September 13, 2019

As Friday the 13ths go, not so bad. Large Cap US stocks, as measured by the S&P 500 total return index, have broken out and are approaching all-time highs reached earlier in the summer.  The index spent the better part of August consolidating after peaking in late July.  The positive market movement has boosted investor morale as the American Association of Individual Investors Bull-Bear Spread has just turned modestly positive. Improved investor sentiment and further market advances could persist with dovish signaling from the US Federal Reserve, a more positive tenor in US – China trade discussions, and corporate fundamentals and equity market valuations which remain supportive.  The US 10 Year Treasury Yield now stands at 1.7% (9/12/2019) after reaching 1.46% on September 3, 2019 indicating that, for now, the flight to safety trade may be off as well. Many reasons to remain watchful though.  Mario Draghi’s transition out of his leadership role at the ECB leaves some uncertainty regarding the bank’s future commitment to strong monetary support. The onset of Brexit carries its own uncertainties and the economic slowdown in China may be deepening.

WCM Chart of the Week for September 6, 2019

WCM Chart of the Week for September 6, 2019.  Large Cap US stocks continue to outperform with the S&P 500 total return reaching 20.7% YTD through (September 5, 2019).  This end of the US equity market, in particular, the Technology sector, contains the world’s strongest performers so far in 2019.  US Small Cap equities however have lagged considerably, only gaining 13.2% over the same time period while global stocks as measured by the FTSE Global All Cap Index have advanced 15.8%.

Economic trends in the US are much more favorable than in other key regions such as Europe and Asia. US Small Cap companies generally are more domestically oriented while Large US companies earn significant amount of revenue overseas.  Intuitively, the global environment should favor US Small Caps but that has not been the case.  The key might be the low interest rate environment enabling large companies to raise substantial amounts of debt through the corporate bond market while smaller companies are more dependent on regional bank financing. Another key factor explaining the performance disparity between Large and Small Cap stocks may be sector representation.  The financial sector of the S&P 500 represents roughly 12% of the index while the Russell 2000 has about 17%.  The financial sector has been a laggard overall and a small financial service company’s revenue is generally more dependent on lending which tends to struggle in low interest rate environments.

This week’s chart shows the total return relationship of US Large relative to Small Cap Equities.  Large Cap stocks are trading at their highest levels relative to Small Caps in at least the past 15 years and are clearly extended.  This is highly unusual but may persist at least until the US Federal Reserve ends its current rate cutting path and other monetary stimulus activities. [chart courtesy of Bloomberg LP (c)2019]

WCM Chart of the Week for August 30, 2019

As we end the month of August US stocks have contracted 1.7% while US bonds have advanced 2.5% (through 8/29) and it seems like we have been in a tug of war between the asset classes since at least last fall.  Could we be at a pivot point when investors rotate back into equities?  The chart below shows the total return relationship between the S&P 500 and the Bloomberg Barclays Aggregate indices and it appears that large cap US stocks may be bottoming relative to bonds.  The bond market has been supported by a benign interest rate environment as the yield on the US 10 Year Treasury Bond has fallen from 2.68% at the beginning of the year to a low of 1.47% on August 27th.  There are several reasons why rates have fallen — no real inflationary pressures and lower and even negative interest rates in the rest of the developed world.  If rates stabilize around current levels, equities should regain leadership given that corporate fundamentals remain solid, market valuations are not elevated, and the US economy is still expanding. [Chart courtesy Bloomberg LP (c) 2019]

Newer posts »