Category: Equities (Page 3 of 4)

WCM Chart of the Week for April 17, 2020

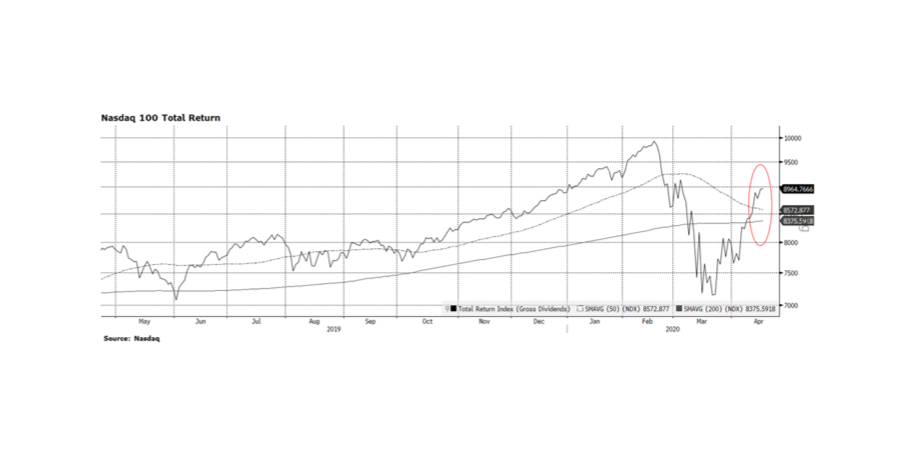
We continue to see encouraging signs in the US stock market as the three main indexes, the Dow, S&P 500 and the NASDAQ Composite have come off of their recent lows on March 23 and are making higher highs and higher lows – a key bullish technical pattern.  Wednesday was interesting because the S&P 500 closed at a higher low even though it fell 2.2% for the day, and Thursday we had a modest follow through gain of 1/2 of a percent or so.  The Nasdaq Composite was even more consequential because we continue to see higher highs after higher lows as well.  And, in this week’s chart, the Nasdaq 100, laden with many of the US’ most innovative companies, is now positive in 2020 (still below its Feb peak) and at levels above its long-term trend lines. 

We are optimistic about US stocks but the recovery in our capital markets remains fragile.  As we have discussed previously, we have to separate the market outlook from the very real emotional human and economic toll this pandemic has taken across the world and in our communities. We believe that a great reawakening will occur that makes us all realize the we need key elements of our economy to be permanently secure and sustainable. US companies stand to benefit, as do American workers, from repatriation of productive capabilities in vital areas like medicine and protective equipment.  Long term, we expect the marginal global investment dollar will likely be invested here in North America. [Chart courtesy NASDAQ and Bloomberg LP © 2020]

WCM Chart of the Moment for March 9, 2020

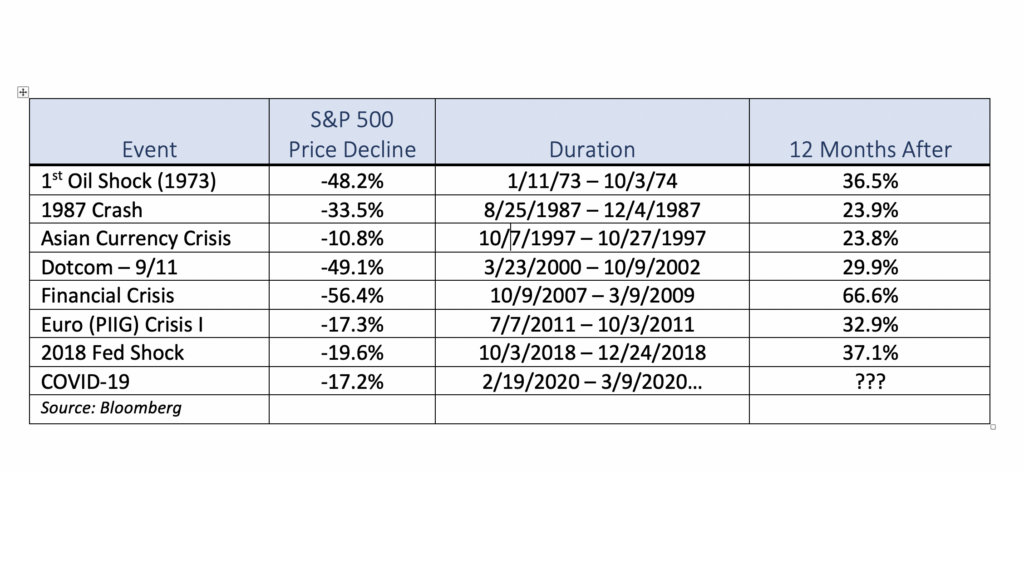
As of this writing stock markets around the globe are reacting violently to the latest COVID-19 related news. From our perspective, while the past several weeks of volatility has been unnerving, it is important to evaluate the current market in the context of previous global events. We have listed several periods over the span of the past 40 years when the US stock market, as measured by the S&P 500, either corrected or even entered a bear market. While this list is by no means exhaustive, it is intended to show that while previous downdrafts were painful, US equities rebounded impressively over the course of the following year once the market bottomed. It is also important to consider that each sell-off was caused by different events both international and domestic in origin as well as ranging in duration, yet stock prices in the US were higher 12 months afterwards. As tragic as this pandemic has been and will likely continue to be, our sense is that US equities will likely follow a similar pattern and be higher a year from now. [data courtesy Standard & Poor’s and Bloomberg LP © 2020]

The view from here

In these last hours before the US markets open for this week’s sessions, here are a few more thoughts we have shared in our community.

Global markets finally caught up, in the negative sense, to China’s stock markets as worries about the COVID-19 “novel” coronavirus spread to the developed West faster than the disease itself. A contagion of concern overtook markets and left us with a week of returns we have not experienced since the Financial Crisis in 2008. What is materially different from our perspective is that this correction is not a response to a lack of faith in the system itself. During the Crisis, securities prices collapsed on the fear that it was actually impossible to value many of them, and that large parts of the system were in fact worthless. In certain cases this did prove to be the case as a sudden disappearance of liquidity exposed a large quantity of bad loans and mortgages that had been ingested by major financial institutions, causing the collapse of systemically important operations like Lehman Brothers, Bear Stearns, Washington Mutual and Countrywide. There was absolutely widespread panic that we could be facing a new Great Depression as the financial system itself seized.

This past week was very different. As we have previously explained, COVID-19 of course has and will continue to have economic consequences, but it does not call into question the soundness of markets, banks and whole economies as we experienced a dozen years ago. We find it likely that the response to the virus will impact company earnings and the GDP of nations. Shutting down the 2nd largest economy (China) for weeks if not months would never have gone unnoticed and unpriced. Reasonably, that demands revisiting what companies are worth and whether yesterday’s prices reflect tomorrow’s realities. Prior to the outbreak, fundamentals were reasonably solid around the world. Not boom, but certainly not bust. The situation we find ourselves in could take that optimism down to modestly solid, or perhaps slightly weakened. But even a mild global recession triggered by this moment does not call into question the fundamental underpinnings of finance and commerce. We are seeing steep and sudden drops in stock markets that remind us of 2008, and nearly unprecedented lows in interest rates, without anywhere near the breakage that brought about those kinds of corrections historically.

So, in a word, why? We see a few different forces at work which all feed our collective response to unconstrained uncertainty. Emotion, namely fear, is always a powerful motivator. Fear of the virus, fear of losing money, reasonably make people want to be safe. 2008 still looms large in the minds of investors and a PTSD-type response is not out of character. Fool me once, shame on you. Fool me twice, shame on me.

That emotion is being fed by a toxic brew of real, or worse, real but incomplete, data without framing or context, and quite a lot of false narratives. Add to that the markets are now patrolled and exploited by algorithms and artificial intelligence engines that can actually capture and quantify shifting sentiment and strong moves one direction or another in prices, and exploit or even amplify or aggravate those moves for profit. We have seen numerous isolated examples of this played out in the “Flash Crash”, the “Fat Finger”, and other moments over the last many years which show how quickly and to what extremes things can break loose on little information or bad information. Throw something at the market like the novel coronavirus and we could experience those types of extreme (over)reactions again and again.

We anticipate that clarity and greater understanding around the virus’ pandemic qualities and impacts will help markets firm up, and would not be surprised to see a fair price for securities settle at something less than the peaks from just a couple weeks ago after accounting for the drag from lowered economic activity. It is also our expectation that we will see some manner of coordinated global response across the major central banks to compensate not for falling stock prices but for potential lost GDP from less commerce, less travel, and less work. Depending on the magnitude of the response this could put a floor in prices, or at least slow the descent and tamp down volatility while investors regain their footing.
WCM Chart of the Week for February 28, 2020

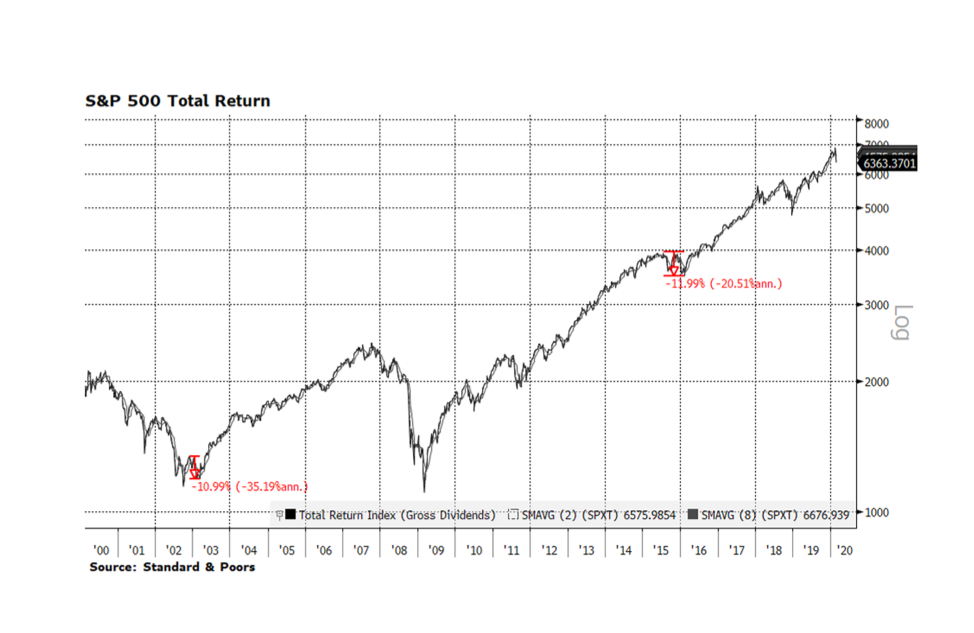
Heightened fears of COVID-19 spreading to other countries and regions over the past few days has unnerved investors and sent global equity markets lower.  Since hitting an all-time high on February 12th, the FTSE Global All Cap Stock Index fell 6.4% just through February 25th. Taken in context, global stocks may continue this week’s trend.  In 2003 the SARS pandemic temporarily derailed the post dot-com recovery in the U.S. The S&P 500 Total Return Index contracted nearly 11% from late November 2002 through early March 2003.  The Zika virus outbreak in 2015-16 also had a similar impact on stocks as the index fell 12% from late July 2015 until bottoming in mid-February 2016.  These instances are cited in this week’s chart.

The corporate environment in America is still quite strong compared to the two periods cited above and the rest of the world today.  One indication can be found in credit markets where investment grade corporate credit prices continue to grind higher in the midst of stock market volatility.  The toll on the human condition is tragic but our sense is that this will pass in time and may turn out to be shorter in duration due to advancements in biotechnology. That is certainly our hope but in the meantime equity markets will likely continue to be volatile. [Data courtesy S&P, chart courtesy Bloomberg LP © 2020]

WCM Chart of the Week for January 22, 2020

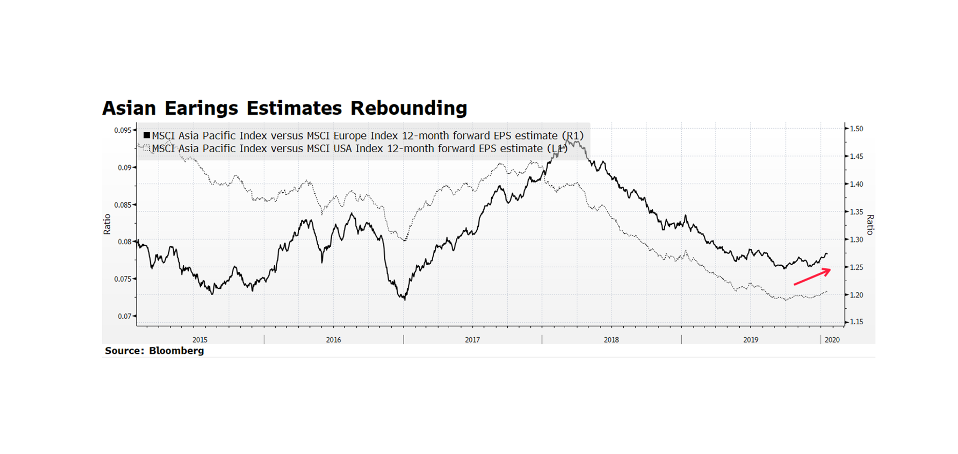
Earnings estimates across corporate Asia are gaining ground on European and even American companies.  This is a welcome sign especially compared to the US with its well publicized solid fundamentals.  Beyond the headlines stemming from social unrest in Hong Kong, many of the region’s stock markets exhibit favorable valuations and may attract investors pursuing stronger growth that is difficult to find in Europe at the moment.  Also, with US equities continuing to hit all-time highs, investors may opportunistically rotate into this part of the world until American indices consolidate. [chart source Bloomberg LP © 2020]

WCM Chart of the Week for January 10, 2020

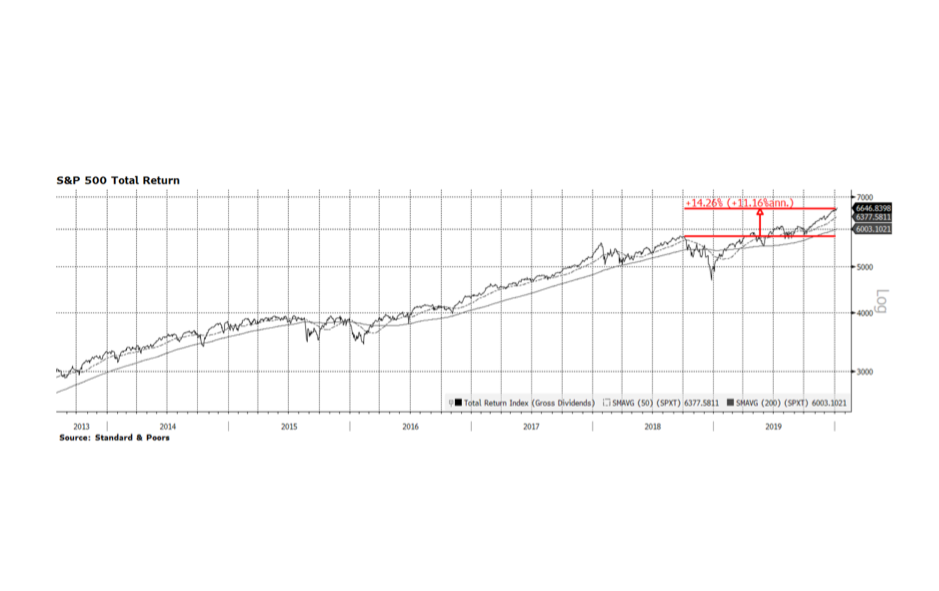
When you measure is everything.  The major stock indices in the United States posted the strongest returns in recent years with the Nasdaq up 36.7%, Dow Jones Industrials up 25.3% and the S&P 500 (pictured below) 31.5% on a total return basis in the calendar year 2019.  These results are undoubtedly impressive but are highly endpoint dependent.  At the beginning of 2019 the equity market was reeling mainly due to the perception that the US Federal Reserve intended to pursue overly restrictive monetary policy only to announce quite the opposite at this time last year.  The beginning of 2019 was a low point for US equity indices and the year ended with all-time record highs, producing very impressive calendar year returns.  What we highlight on this week’s chart is the 14.26% total return (11.16% annualized) of the S&P 500 when measured from the September 2019 high prior to the fourth quarter US Fed-induced market rout. That return is historically strong but not as dramatic as measuring January to January would suggest.

For a bit of recent historical perspective, 2013 surpassed 2019 when the Nasdaq, Dow Jones and S&P 500 delivered total returns of 41.7%, 29.7%, and 33.1% respectively, followed by solid returns (all three indices posted 10%+ total returns) in 2014. [data courtesy S&P, chart courtesy Bloomberg LP © 2020]

WCM Yule Chart for 2019

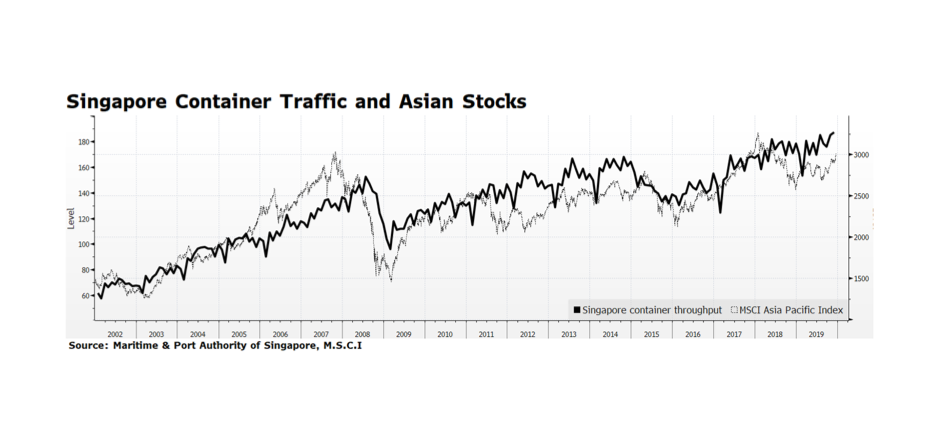
Nothing says holiday cheer like Asian exports. Actually, come to think of it that probably says a lot about holiday cheer depending on what is under your tree, menorah, or Festivus pole. Equities in Asia have been rallying since early this Fall but have underperformed global peers this year. But, on a positive note, container traffic in Singapore just hit an all-time high, which should be supportive of Asia’s bourses going forward. The reason container traffic is important is because it is a barometer of trade momentum in the region and Singapore is a strategic transfer point for goods. Its exports hover around 200% of GDP.  Trade flows should continue to improve with Phase 1 of the US – China trade agreement and US House of Representatives passage of the US Mexico Canada Agreement (passage in the US Senate is likely).  These developments are critical considering global economic activity is moderating. [chart courtesy Bloomberg LP © 2019 and Maritime & Port Authority of Singapore, MSCI]

WCM Chart of the Week for December 6, 2019

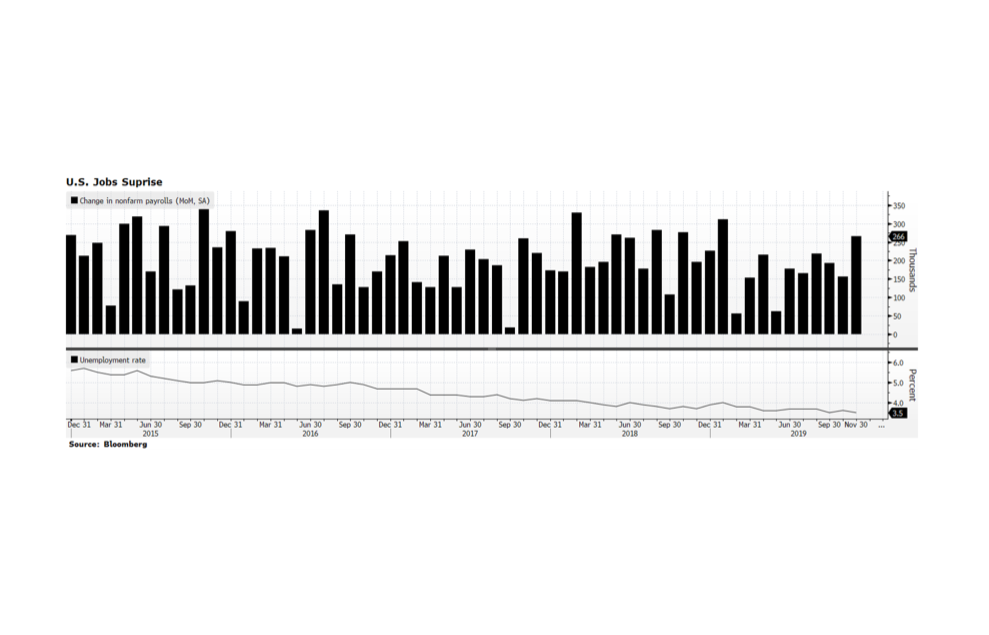
This morning the Labor Department announced that payrolls expanded by 266,000 in November, well ahead of estimates.  Just as important, the previous month’s jobs were revised upwards to 156,000 and the unemployment rate matched the 50-year record low of 3.5%.  Average hourly wages also expanded 3.1% signaling that consumers’ wallets are gaining on the overall economy.  Hiring momentum is no doubt strong and is outpacing growth in the labor force.  While this is good for employees currently, continued wage inflation may cut into future corporate profits.  The low inflation environment may make it difficult for companies to raise prices as wage pressures may crowd out margins. [chart courtesy Bloomberg LP (c) 2019]

WCM Chart of the Week for November 15, 2019

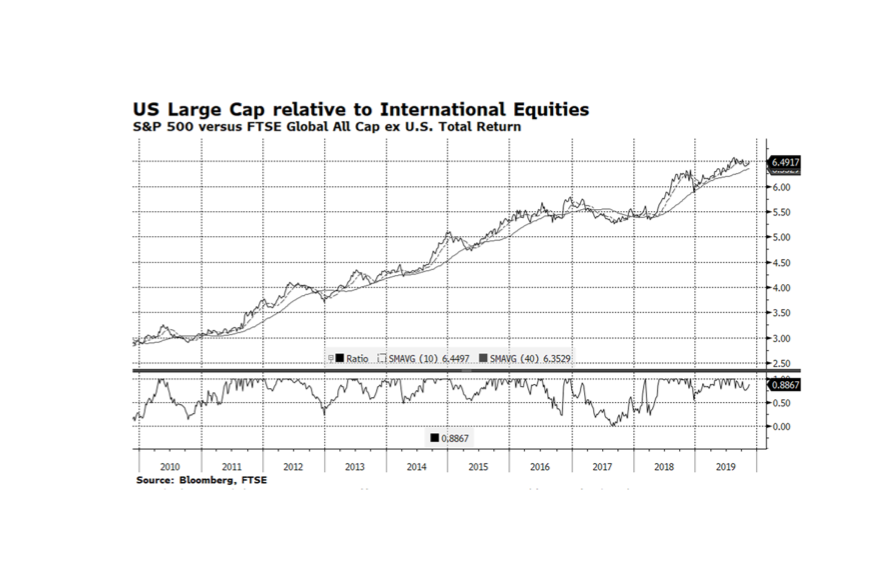
Large Cap stocks in the United States have outperformed the rest of the world for the better part of the past ten years largely because of superior demographic, economic and corporate conditions in America.  However, there have been several periods this decade when international bourses have gained ground on America and that has been the case since mid-August this year.  While US companies have tended to exhibit robust fundamentals compared to their international rivals, stock market valuations favor international equities. Can the rest of the world continue to outpace the US?  We continue to favor American stocks and bonds because economic conditions abroad continue to be challenging.  Eurozone economic activity is barely expanding, although the German economy did surprise on the positive side (thus narrowly avoiding a recession) and Chinese GDP growth may be slowing more than expected.  The headwinds international markets face may prove to be too much to overcome from a relative performance standpoint. [chart courtesy Bloomberg LP (c) 2019]

WCM Chart of the Week for November 8, 2019

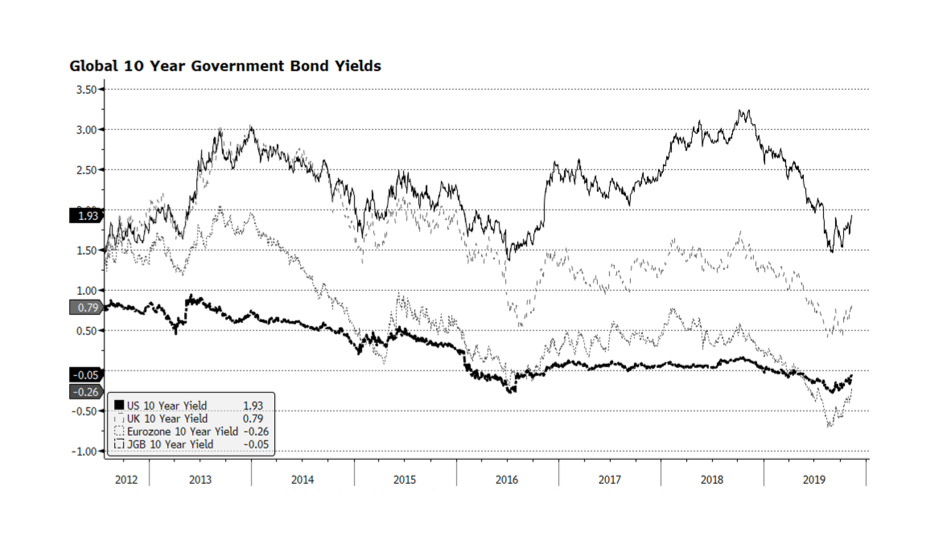
The global rally in stocks and key US equity indices hitting all-time highs are again garnering the majority of the financial press’ collective attention. We however prefer to focus on government bond markets. Long-term interest rates may have bottomed towards the end of this past summer. 10-year government bond yields in key developed economies are on the upswing and may even have positive readings in Japan and the Eurozone before year end. We find the upward interest rate trajectory interesting in the context of the US Federal Reserve’s recent decision to lower its target rate. It is encouraging that yields are rising together which may be a signal that economic conditions across the globe are stabilizing and safe haven asset prices are falling. [chart courtesy Bloomberg LP © 2019]

« Older posts Newer posts »