On the last day of Climate Week, we shift our focus from where we started with bonds to conclude with global equities. One of the tired old tropes that gets trotted out for people who have not looked at the data is that ESG-oriented strategies are structurally disadvantaged and destined to underperform. Of course, every strategy follows its own course based on benchmarks, PM decisionmaking, trading effectiveness, and a variety of other factors. But if we take the discretionary elements out and just focus on index comparisons, we do not find any persistent lag or advantage. Yes, performance varies somewhat in the short term.
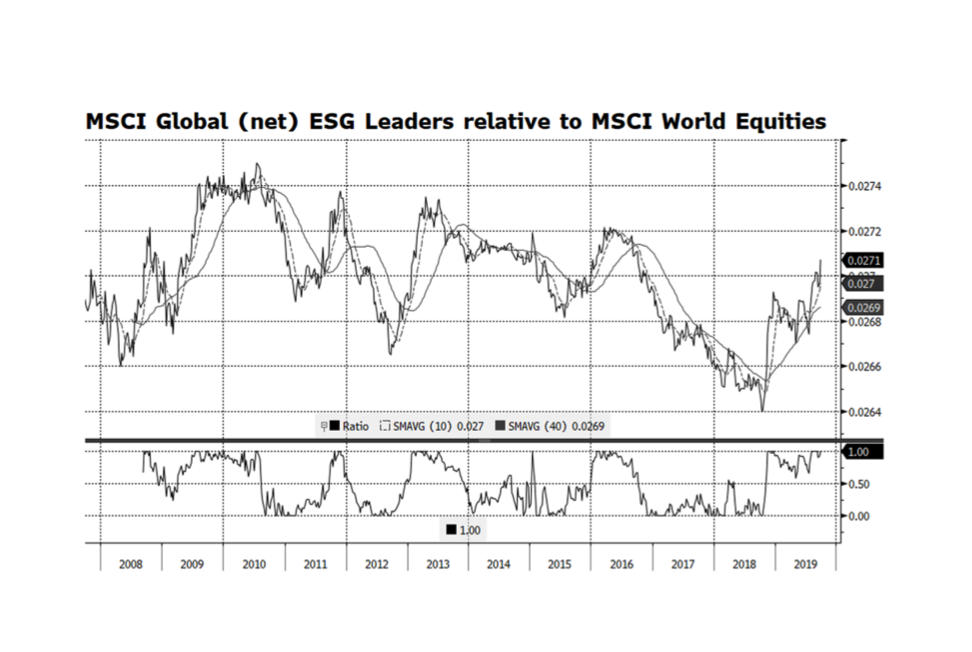
Sometimes ESG leads, sometimes it lags. Over market cycles though, these small variations sort themselves out and you end up in the same place. MSCI, one of the world’s preeminent index authorities, has maintained an ESG Leaders series of equity indices that start in 2007. According to Bloomberg, since the inception of the global ESG Leaders Index (on September 28, 2007) through September 26, 2019, the ESG index total return is 72.4% compare to 71.3% for the global equity index, or annualized total returns of 4.64% and 4.59%, respectively. This week’s chart shows this relationship graphically and there do appear to be cycles of outperformance as well as underperformance of the ESG index. However, this is considerably exaggerated by the scale of the chart as the differences measure in fractions of basis points.