Category: Coronavirus (Page 4 of 5)

WCM Chart of the Week for April 24, 2020

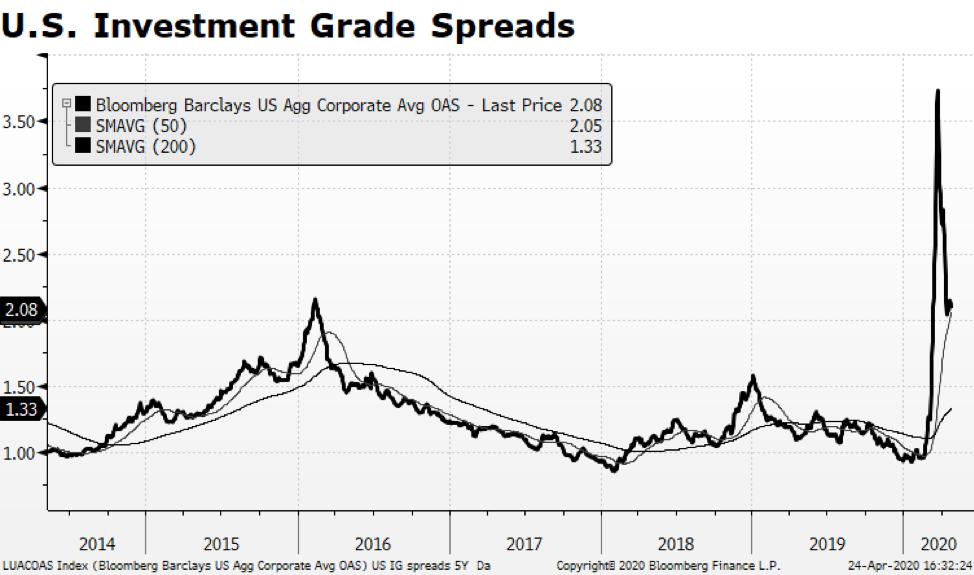
A positive development has surfaced within the US fixed income market — Investment Grade Corporate Credit spreads have narrowed relative to the 10-year US Treasury yield, yet still remain wide by historical measures. There may be some opportunity in that sector of the bond market. Even with that backdrop, oil price volatility unnerved many observers as the near-term WTI contract (for May 2020 delivery) priced with a negative sign Monday closing at a bizarre -$37.63. It has since recovered to about $17. Ongoing anemic demand combined with a lack of available storage to create a moment where there was no immediate bid for oil.  From an equity market standpoint, the impact was limited though as the major integrated energy companies continued to rebound along with the overall stock market. Importantly, the sector currently stands at only 2.9% of the S&P 500 while 10 years ago it represented nearly three times that share of the index.

We are optimistic about US capital markets, but the health crisis will continue to generate grim news and adversely impact the labor market and the overall economy.  This week’s first-time unemployment claims brought the running total to 26.5 million American jobs, essentially wiping out all job gains since the Great Recession. The US is far from out of the woods, but the market is handicapping a positive outcome in the long term.

WCM Chart of the Week for April 17, 2020

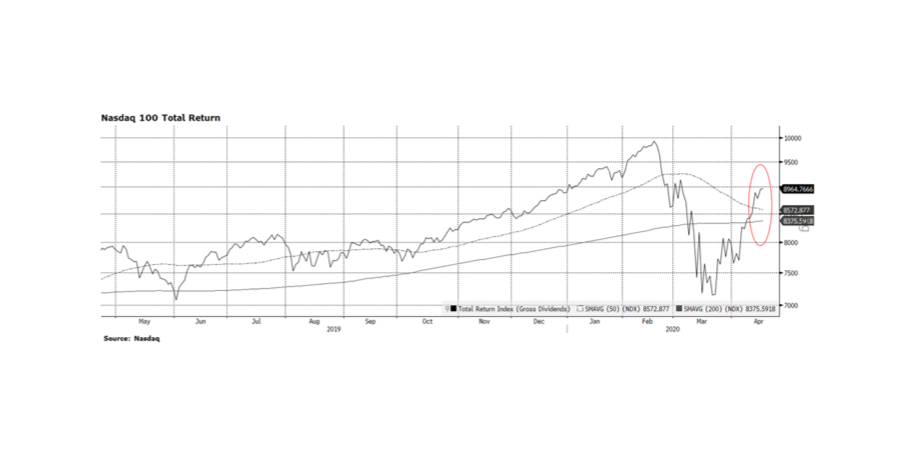
We continue to see encouraging signs in the US stock market as the three main indexes, the Dow, S&P 500 and the NASDAQ Composite have come off of their recent lows on March 23 and are making higher highs and higher lows – a key bullish technical pattern.  Wednesday was interesting because the S&P 500 closed at a higher low even though it fell 2.2% for the day, and Thursday we had a modest follow through gain of 1/2 of a percent or so.  The Nasdaq Composite was even more consequential because we continue to see higher highs after higher lows as well.  And, in this week’s chart, the Nasdaq 100, laden with many of the US’ most innovative companies, is now positive in 2020 (still below its Feb peak) and at levels above its long-term trend lines. 

We are optimistic about US stocks but the recovery in our capital markets remains fragile.  As we have discussed previously, we have to separate the market outlook from the very real emotional human and economic toll this pandemic has taken across the world and in our communities. We believe that a great reawakening will occur that makes us all realize the we need key elements of our economy to be permanently secure and sustainable. US companies stand to benefit, as do American workers, from repatriation of productive capabilities in vital areas like medicine and protective equipment.  Long term, we expect the marginal global investment dollar will likely be invested here in North America. [Chart courtesy NASDAQ and Bloomberg LP © 2020]

WCM Chart of the Week for April 10, 2020

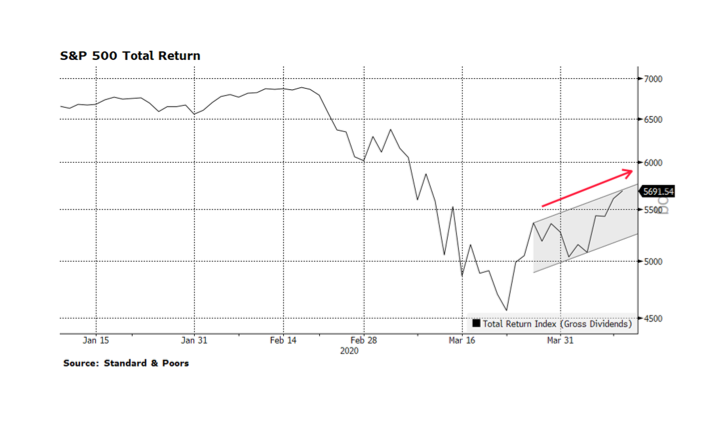
Over the past week we have witnessed encouraging signs in US equities as the three main indexes, the Dow Jones Industrial Average, the S&P 500 and the NASDAQ Composite have come off of their recent lows on March 23 and are making higher highs and higher lows – a key bullish technical pattern.  We are optimistic about US stocks but also understand that we are quite far from containing this health crisis and the recovery in our capital markets remains fragile.

The rout that began in earnest late February has arguably been exacerbated by State and Federal government-led virus containment efforts — business, school, recreational closures as well as encouraging social distancing — that have effectively suppressed the economy.  Throughout history recessions, depressions and bear markets were caused by bubbles bursting like Asian currencies, Dotcom companies, US mortgages, and not by intentional government economic restraint.  Government intervention normally supports economic activity.

Along with roughly $1.8 trillion in asset purchases and other stimulus from the Federal Reserve, The US Federal Government has approved and is now implementing the $2.3 trillion CARES Act directly supporting American families, small businesses and larger corporations. An important aspect of the package is the speed that funds will be sent directly to citizens, anticipated to be just a few weeks.  This is critical considering that over 16 million Americans have filed for first-time unemployment assistance in the past three weeks alone.

Taken together, monetary and fiscal policy stimulus surpasses $4 trillion being injected into the American economy which could represent greater than 20% of GDP.  At the same time, large swaths of the US economy remain virtually frozen as COVID-19 infection rates peak.  There is nothing in modern history like this tension between top-down support and restraint to compare and judge an outcome, but in the longer term we believe support will win out. [Chart courtesy S&P and Bloomberg LP © 2020]

WCM Chart of the Week for April 3, 2020

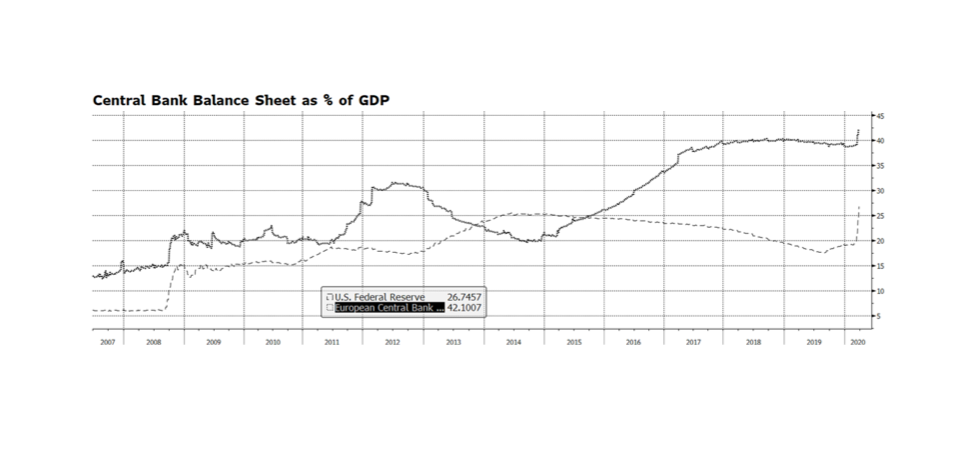
The US Federal Reserve has taken several powerful steps in recent weeks ranging from lowering policy interest rates, intervening in credit markets to provide stability and re-engaging in asset purchases, also known as QE. The amount of monetary stimulus is unprecedented and staggering. Since March 4, the Fed’s balance sheet has expanded nearly $1.6 trillion through their asset purchase plan, accumulating Mortgage Backed Securities, Treasuries and Corporate Credit. That is an incredible amount of expansion in such a short period of time considering that it took some 15 months during the financial crisis from when the QE program began to reach an equivalent level of assets. Some are concerned that the Fed has expended all of its monetary tools and that is a real concern given policy rates are at or near zero. The balance sheet now stands near $5.9 trillion, a level that just a few years ago would have seemed unimaginable. But it could become even larger. The Fed’s balance sheet represents nearly 27% of US GDP. By contrast the European Central Bank’s balance sheet stands at over 42% of European Union GDP. The Bank of Japan stands at over 100% of GDP. The Fed’s asset purchase program could even become more active and remain manageable, especially considering the relative vibrancy of our economy compared to Europe and Japan. [chart courtesy Bloomberg LP © 2020]

WCM Chart of the Week for March 23, 2020

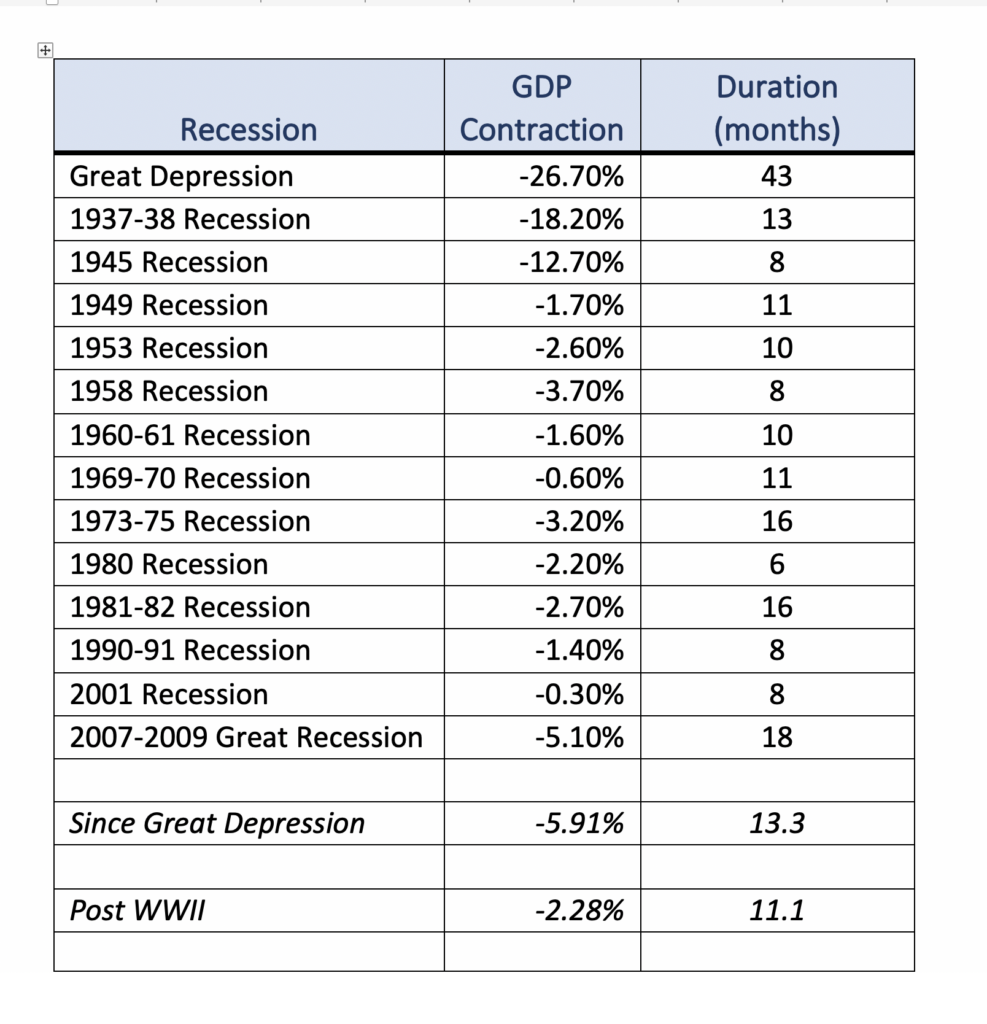
Economists are forecasting in some cases severe contractions in US GDP through the next quarter due to the impact of the COVID-19 virus. We believe that the US economy started decelerating at the beginning of March and it is extremely difficult to estimate the extent of the slowdown. America has likely never before experienced as abrupt an economic disruption. In this week’s chart (table) we have enumerated the National Bureau of Economic Research list of recessions beginning with the Great Depression. The average contraction in GDP since the Great Depression is 5.9% and lasted 13 months. Post WW II in the industrial rebound-fueled era the average contraction was 2.3%, lasting 11 months. Economists’ current forecasts range from declines in GDP growth in the mid-single digits to close to 10% from current quarter to Q2 2020. America has not realized that level of contraction in economic activity for over 70 years.

The American economy is vastly more modern and resilient than in the past and the US Federal Reserve and federal government have pledged as much as $1.7 trillion in monetary and fiscal expenditures to buttress the economy. That extraordinary amount is nearly 8% of nominal GDP. We could experience a sharp rebound as this injection of liquidity stimulates spending, a temporary wealth effect, and pent-up demand stemming from service-sector employees returning to the labor force when this crisis subsides.

A new definition for “systemically important” businesses

At the peak of the Financial Crisis in the stretch from 2007 to 2009, we became familiar with the notion of systemically important institutions. With the failure of major banks and investment banks like Bear Stearns, Lehman Brothers, Countrywide and Washington Mutual, the private and public sectors had to come to grips with the idea that for-profit businesses could be so essential to the orderly functioning of the overall capitalist system that they could not be allowed to fail, even if that required the rescue of a public company with taxpayer money. This notion gave rise in part to a series of laws and regulations including the Dodd-Frank Wall Street Reform and Consumer Protection Act. Certain financial institutions were too important either by virtue of function or size or both to be allowed to fail, undermining confidence and the orderly conduct of our economy and markets. These institutions would be protected, but they would also be more critically regulated to mitigate the risk of failure.

Whether standing in long lines of anxious neighbors to stock up on staples or watching a public address from the White House rose garden, we have been presented with a new and really more fundamental notion of what a systemically important business is. In fact, the shelter-in-place approach to mitigating the spread of COVID-19 has created a new class of systemically important businesses as we redefine, on the fly, what used to be luxuries like working from home or having household staples delivered as now being existential.

Through the present market turmoil, it is difficult to see this new order clearly, but in the months and years to come we will collectively be forced to reflect on what we are learning through experience now. There are fundamentals to the orderly functioning of communities and societies that we all know intuitively, and yet we continually fail to prioritize until we are tested. Right now we are sitting at the bottom of Maslow’s hierarchy of needs, focusing on physiological and safety needs. That’s health, food, water, shelter, personal security, financial security, and so on. Our current situation is depriving us of the ability to climb further and focus even on social belonging because of the paramount importance of the first two.

We can make light of the run on toilet paper, canned goods and hand sanitizer, but that is as explicit a manifestation as there is of what matters right now – health and hygiene and nutrition. The systemically important are food producers and grocery stores, pharmaceutical companies and pharmacies, hospitals and laboratories. They are also the providers of basic infrastructure, public and private, that keep the lights on, the water flowing, and goods and services moving from point A to point B so we can be home and be socially distant. We are also going to get a graphic look at how fragile the bottom of the economic ladder is where access to basic physiological and safety needs is not assured on a good day much less in the midst of a crisis.

From an investor’s perspective, this will cause a re-rating of securities according to what really matters when we are against the wall. From municipal finance to support hospitals and emergency workers to ownership of companies that are essential to the food supply chain, we will have a renewed and clarified sense of where our investment capital is the most needed and where it should be treated with the highest levels of stewardship and oversight, whether or not it is backstopped by government, because these companies and services are simply too systemically important to fail. And with that, there is an opportunity for companies and for governments to rethink stakeholder rights and responsibilities, and to provide best-in-class transparency and good governance and prioritize quality and longevity over short term rewards.

WCM Chart of the Week for March 16, 2020

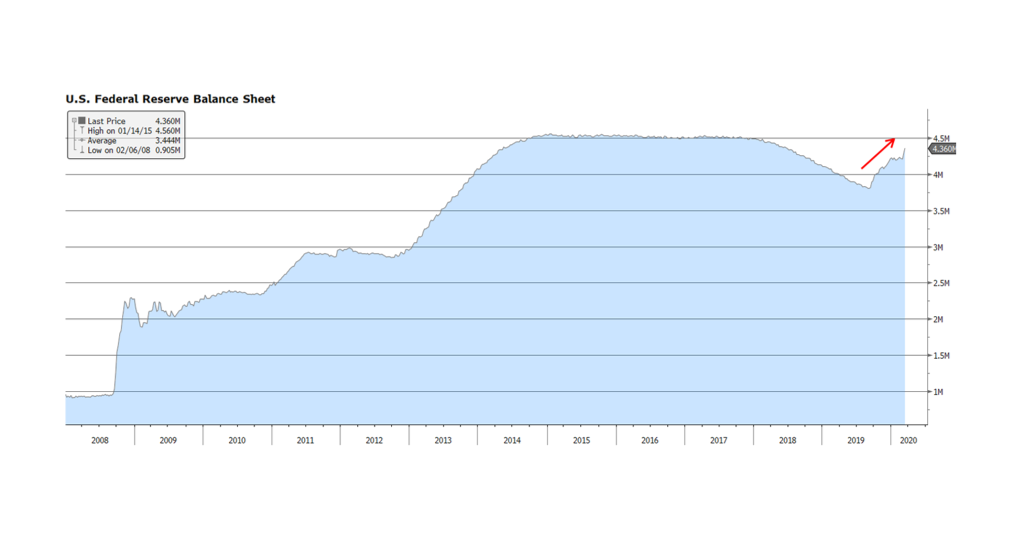
On Sunday, March 15, 2020 after an emergency meeting, the US Fed announced that it was lowering the US Fed funds target rate by 100 basis points to a range between zero and 0.25%, and that it will expand its bond holdings by at least $700 billion.  The expansion of the Fed’s balance sheet, depicted in this week’s chart, will likely bring it to levels surpassing records reached in the aftermath of the Financial Crisis.  Hyper accommodative measures being undertaken by the Fed (and other central banks) are occurring simultaneously with aggressive fiscal measures being enacted by the Trump administration and the US Congress.  The magnitude of the fiscal and monetary spending underscores the degree of uncertainty regarding the economic and social impact of the COVID-19 virus.  What had been a robust economic and fundamental backdrop in America just a few short weeks ago will likely turn out to be a low-growth to stagnating to contracting-growth environment during the current quarter and likely the following quarter.  The economic downshift beyond the Summer is a major question mark and will be dependent on the efficacy of containment measures, potential seasonal dormancy of the virus, and successful treatments and outcomes. [chart courtesy Bloomberg LP © 2020]

WCM Chart of the Moment for March 9, 2020

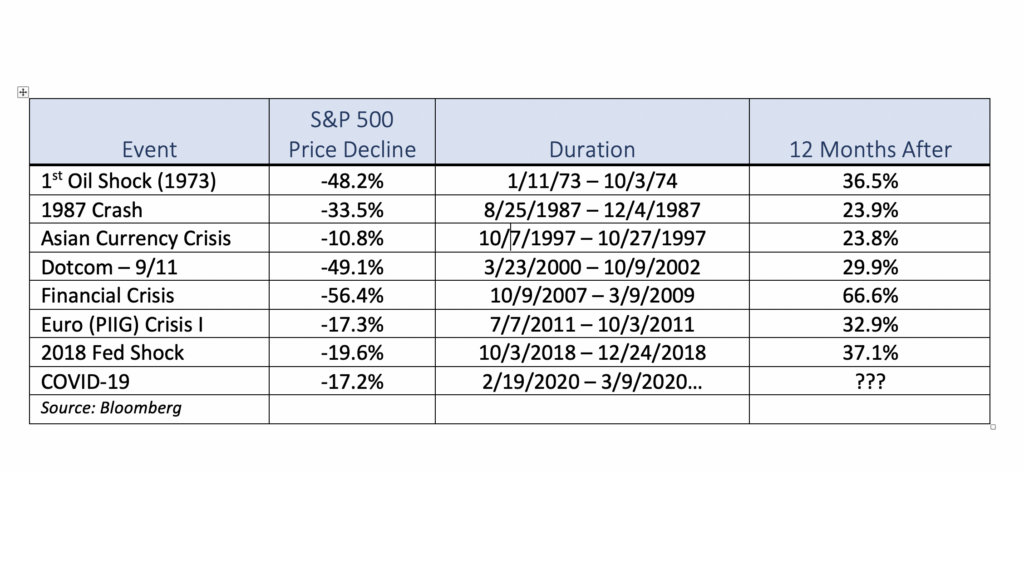
As of this writing stock markets around the globe are reacting violently to the latest COVID-19 related news. From our perspective, while the past several weeks of volatility has been unnerving, it is important to evaluate the current market in the context of previous global events. We have listed several periods over the span of the past 40 years when the US stock market, as measured by the S&P 500, either corrected or even entered a bear market. While this list is by no means exhaustive, it is intended to show that while previous downdrafts were painful, US equities rebounded impressively over the course of the following year once the market bottomed. It is also important to consider that each sell-off was caused by different events both international and domestic in origin as well as ranging in duration, yet stock prices in the US were higher 12 months afterwards. As tragic as this pandemic has been and will likely continue to be, our sense is that US equities will likely follow a similar pattern and be higher a year from now. [data courtesy Standard & Poor’s and Bloomberg LP © 2020]

The view from here

In these last hours before the US markets open for this week’s sessions, here are a few more thoughts we have shared in our community.

Global markets finally caught up, in the negative sense, to China’s stock markets as worries about the COVID-19 “novel” coronavirus spread to the developed West faster than the disease itself. A contagion of concern overtook markets and left us with a week of returns we have not experienced since the Financial Crisis in 2008. What is materially different from our perspective is that this correction is not a response to a lack of faith in the system itself. During the Crisis, securities prices collapsed on the fear that it was actually impossible to value many of them, and that large parts of the system were in fact worthless. In certain cases this did prove to be the case as a sudden disappearance of liquidity exposed a large quantity of bad loans and mortgages that had been ingested by major financial institutions, causing the collapse of systemically important operations like Lehman Brothers, Bear Stearns, Washington Mutual and Countrywide. There was absolutely widespread panic that we could be facing a new Great Depression as the financial system itself seized.

This past week was very different. As we have previously explained, COVID-19 of course has and will continue to have economic consequences, but it does not call into question the soundness of markets, banks and whole economies as we experienced a dozen years ago. We find it likely that the response to the virus will impact company earnings and the GDP of nations. Shutting down the 2nd largest economy (China) for weeks if not months would never have gone unnoticed and unpriced. Reasonably, that demands revisiting what companies are worth and whether yesterday’s prices reflect tomorrow’s realities. Prior to the outbreak, fundamentals were reasonably solid around the world. Not boom, but certainly not bust. The situation we find ourselves in could take that optimism down to modestly solid, or perhaps slightly weakened. But even a mild global recession triggered by this moment does not call into question the fundamental underpinnings of finance and commerce. We are seeing steep and sudden drops in stock markets that remind us of 2008, and nearly unprecedented lows in interest rates, without anywhere near the breakage that brought about those kinds of corrections historically.

So, in a word, why? We see a few different forces at work which all feed our collective response to unconstrained uncertainty. Emotion, namely fear, is always a powerful motivator. Fear of the virus, fear of losing money, reasonably make people want to be safe. 2008 still looms large in the minds of investors and a PTSD-type response is not out of character. Fool me once, shame on you. Fool me twice, shame on me.

That emotion is being fed by a toxic brew of real, or worse, real but incomplete, data without framing or context, and quite a lot of false narratives. Add to that the markets are now patrolled and exploited by algorithms and artificial intelligence engines that can actually capture and quantify shifting sentiment and strong moves one direction or another in prices, and exploit or even amplify or aggravate those moves for profit. We have seen numerous isolated examples of this played out in the “Flash Crash”, the “Fat Finger”, and other moments over the last many years which show how quickly and to what extremes things can break loose on little information or bad information. Throw something at the market like the novel coronavirus and we could experience those types of extreme (over)reactions again and again.

We anticipate that clarity and greater understanding around the virus’ pandemic qualities and impacts will help markets firm up, and would not be surprised to see a fair price for securities settle at something less than the peaks from just a couple weeks ago after accounting for the drag from lowered economic activity. It is also our expectation that we will see some manner of coordinated global response across the major central banks to compensate not for falling stock prices but for potential lost GDP from less commerce, less travel, and less work. Depending on the magnitude of the response this could put a floor in prices, or at least slow the descent and tamp down volatility while investors regain their footing.
WCM Chart of the Week for February 28, 2020

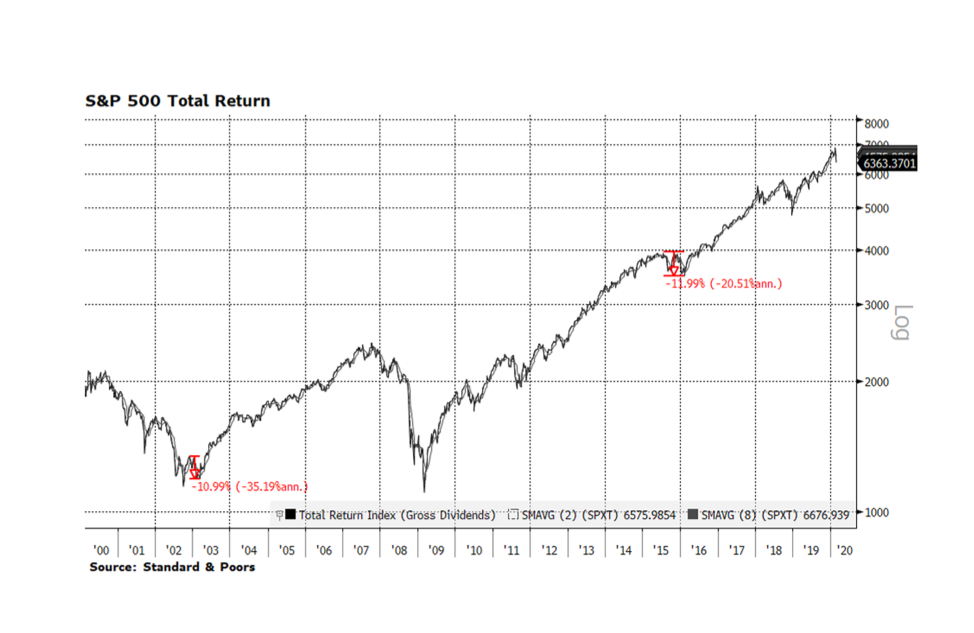
Heightened fears of COVID-19 spreading to other countries and regions over the past few days has unnerved investors and sent global equity markets lower.  Since hitting an all-time high on February 12th, the FTSE Global All Cap Stock Index fell 6.4% just through February 25th. Taken in context, global stocks may continue this week’s trend.  In 2003 the SARS pandemic temporarily derailed the post dot-com recovery in the U.S. The S&P 500 Total Return Index contracted nearly 11% from late November 2002 through early March 2003.  The Zika virus outbreak in 2015-16 also had a similar impact on stocks as the index fell 12% from late July 2015 until bottoming in mid-February 2016.  These instances are cited in this week’s chart.

The corporate environment in America is still quite strong compared to the two periods cited above and the rest of the world today.  One indication can be found in credit markets where investment grade corporate credit prices continue to grind higher in the midst of stock market volatility.  The toll on the human condition is tragic but our sense is that this will pass in time and may turn out to be shorter in duration due to advancements in biotechnology. That is certainly our hope but in the meantime equity markets will likely continue to be volatile. [Data courtesy S&P, chart courtesy Bloomberg LP © 2020]

« Older posts Newer posts »