Category: Chart of the Week (Page 8 of 18)

WCM Chart of the Week for September 11, 2020

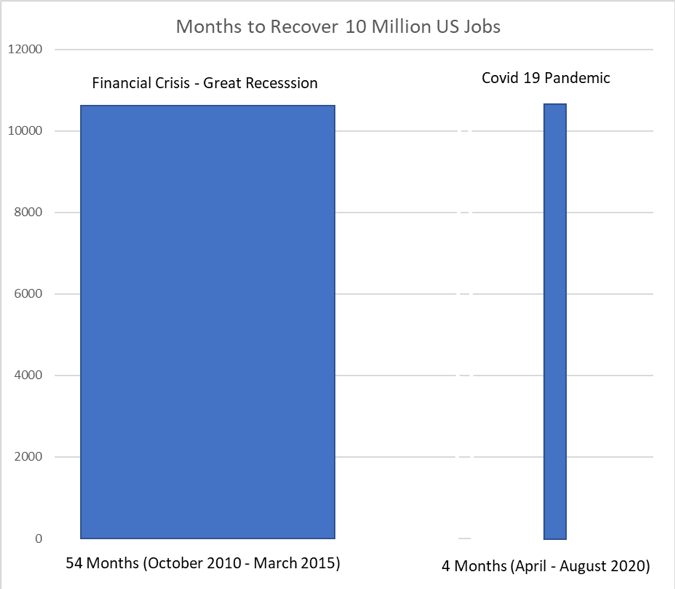
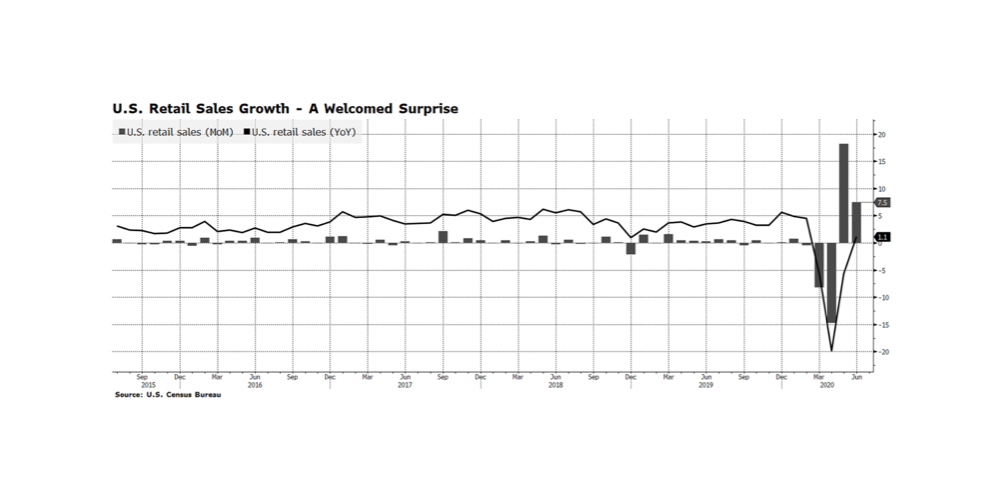
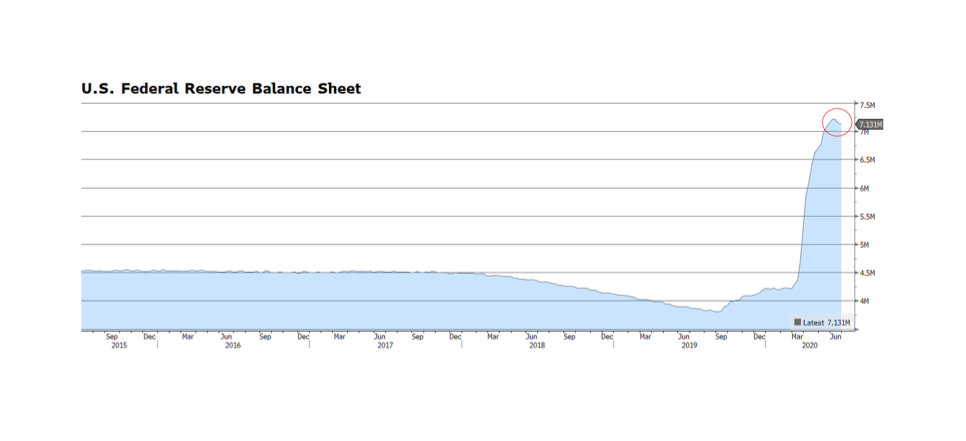
August’s labor market statistics were encouraging and suggest that the US economic recovery is far from normal. According to the BLS, Nonfarm Payrolls expanded 1.37 million in August, slightly above expectations, and the unemployment rate dropped by more than expected to 8.4% versus consensus expectations of 9.8%. While the number of unemployed dropped by 2.8 million, there are still 13.6 million Americans out of a job, which is 7.8 million more than in February.  The nature of the recession, which appears to be largely behind us, is like none ever experienced because it was government induced nearly worldwide. Governments across the globe intentionally suppressed economic activity rather than act in their normal supportive role. Recessions are often caused by structural imbalances such as excess leverage in the financial sector, over-accommodative monetary policy causing hyper-extended stock market valuations, overvalued currencies and commodity price shocks.  These types of imbalances did not exist in the US for the most part prior to the pandemic and that may have set the conditions for a faster recovery. One dramatic example — over 10 million jobs have been recovered since April. By comparison, it took 54 months, from October 2010 to March 2015, for an equivalent number of jobs to be recreated in the aftermath of the Financial Crisis. [data from the US Bureau of Labor Statistics]

WCM Chart of the Week for August 28, 2020

The US stock market continues to rebound from the pandemic panic-driven lows, with the NASDAQ and S&P 500 continuing to post new all-time highs over the past several weeks. This is prompting investors to question if the current rally can last, or even if it marks the beginning of a new bull market.  There are risks that could derail the stock market’s advance ranging from tensions with China, resurging virus hot spots, social upheaval around the country, and the upcoming national elections. The US labor market is also a persistent drag and will not likely have recovered until well into 2021.

There are several factors that are supportive of asset prices including unprecedented fiscal and monetary support, and mounting positive momentum in key economic sectors such as manufacturing, housing and the consumer.  As previously mentioned in our COTWs, in the US personal savings rates remain elevated and personal balance sheets have been de-levered, suggesting the consumer has the ability to spend if they wish.  This week’s chart highlights total assets in money market funds, which remain near peak levels suggesting private investors have been underexposed to equities during the stock market’s historic recovery rally.  This is a condition many cite as additional evidence that equities could continue to advance higher in the months ahead. [chart courtesy Bloomberg LP © 2020]

WCM Chart of the Week for August 21, 2020

A few weeks ago we discussed US consumer trends, citing the elevated personal savings rate as reported by the BEA, in addition to citing expanding personal consumption. The relatively high personal savings rate suggests that there could be pent-up consumer demand to put that money to work. This week’s chart highlights total consumer credit outstanding, which has declined considerably since its pre-pandemic peak at the end of February. The decline in personal balance sheet leverage suggests that American households can access credit as needed or desired. This data is not very timely as June 30 is the most recent report, but it does suggest that the consumer is not as distressed as in previous recoveries.

The labor market continues to be the most restraining issue facing the economy — 14.8 million continuing jobless claims with initial claims amounting to 1.1 million this past week. But, the Bureau of Labor Statistics reported July payroll jobs expanded in 40 states, declined in one and were essentially flat in the remaining nine. We do need a broader and more inclusive jobs recovery because, as the BLS reports, the large increase in average hourly earnings is not good news — It reflects lower-paid workers being pushed out of the work force due to COVID-19 related business suspensions and closures. Strengthening trends in housing and manufacturing should spur further job growth and help restore this disenfranchised segment of the workforce. [Chart courtesy US Federal Reserve, Bloomberg LP (c) 2020]

WCM Chart of the Week for August 17, 2020

Over the last several months we have cited several factors that, in our view, explain why the US stock market indices have been rising and may continue to do so. The most significant contributors are measures being undertaken by the US Federal Reserve and Federal government to support the labor market. The US consumer has been responding by increasing consumption, and so we see core components of the US economy like auto purchases and manufacturing rebounding. The official unemployment rate is still terribly high, measuring 10.2% in July, but that is a significant improvement over 11.1% in June.

Pandemic-related government-mandated lockdowns are being lifted (although in some areas of the country those being reinstituted) and economic trends should continue to improve as people return to work and to consumption.  Critically, there are encouraging signs related to COVID-19.  According to the National Center for Health Statistics (part of the CDC), weekly total provisional deaths as of August 8th registered 438, lower than the pre-surge figure registered on March 21st. These totals are significantly lower than figures cited by media outlets and Johns Hopkins University, a consequence of how deaths are verified and reported, but most importantly we are seeing improving trends regardless of methodology, and that is a relief.  Very well known yet still necessary to point out, this week’s chart demonstrates the concentration of fatalities for those age 55 and older, showing the terrible risk to and impact on the elderly. But, by contrast, the low concentration and declining trend among the young may alleviate concerns about the upcoming school year and broadening re-openings across the country.

WCM Chart of the Week for August 7, 2020

According to the Bureau of Economic Analysis, Americans are saving their disposable income at unprecedented levels. The savings rate is persisting well above previous peaks reached during recessionary periods spanning nearly 35 years. Americans are sitting on their wallets for obvious reasons – fears of the coronavirus, government mandated lock-downs and broad feelings of economic insecurity. The overall rate, while declining steadily since its April peak of 33.5%, stands at a level that is two to three times the percentage of previous recessions. That suggests to us that there is pent-up demand that could help bring the economy out its current nadir. Personal spending has been rebounding, with June’s monthly figure climbing 5.6%, building on May’s 8.5% advance. We call attention to the fact that the June report beat expectations while May was revised upward. There is still a tremendous amount of uncertainty related to COVID-19, terrible stress in the labor market and the upcoming national elections in the US, but the American consumer is a powerful economic force that may prove to be spring-loaded. [chart courtesy BEA and Bloomberg LP © 2020]

WCM Chart of the Week for July 31, 2020

Over the past few weeks, corporate earnings across the globe have been showing signs of recovery.  Citigroup’s Global Earnings Revision Index has been climbing for three weeks in a row, encouraging given the economic challenges facing the world.  While this trend is positive, its path will be unpredictable due to COVID-19 related shut down and re-openings in several key economies. The recovery in corporate earnings, if it persists, could alleviate the tragic stress in labor markets and help reinvigorate economic activity heading into 2021. Fiscal support is building momentum with the European Union’s 750 billion Euro stimulus plan (discussed last week) and the anticipated fourth phase of US stimulus.  It does remain to be seen if the enormous amount of spending, both fiscal and monetary, will have a lasting impact.

WCM Chart of the Week for July 24, 2020

The US dollar’s dominance versus the world’s leading currencies may be nearing its end, at least cyclically. Bloomberg’s US Dollar Spot index is essentially flat year-to-date and has given up all its COVID-19 flight-to-safety gains. Since March 20th, the index is down over 8%, driven by gains in the Euro and British Pound. This could be an indication that conditions in the rest of the world are improving, a welcome sign if indeed it proves to be true. One key development in our view, is that the European Union has agreed to a desperately needed 750 billion Euro ($857 billion) pandemic relief plan that is being financed collectively for the first time in history rather than by individual nations. The relief will be targeted at nations hit the hardest and will take the form of grants that will not have to be repaid. This is noteworthy because, for decades, richer northern European nations resisted aiding economically challenged countries during times of duress. This event could prove to be a watershed moment that could lead to a stronger European Union economically and politically and that would be good for the world. [chart courtesy Bloomberg LP © 2020]

WCM Chart of the Week for July 20, 2020

On Thursday, July 16th, the US Census Bureau released Retail Sales figures and month-over-month growth registered a nice surprise — 7.5%, well above the consensus estimate of 5.5%. The prior month’s figures were also revised upward.  We see this as an obvious reflection of the reopening of the US economy and pent up demand.  But, we don’t read much into the positive monthly gain versus the consensus estimate because economists have never had to forecast under conditions that can be considered “lock-down uncertainty”. What we do find encouraging and more interesting is that the reported annual growth rate was 1.1%.  At this time last year the US economy was on firm footing, and yet Retail Sales are modestly above those levels today. While the trajectory of sales growth is a relief, we would not be surprised to see some sluggishness emerge as we collectively digest the flurry of initial purchasing pre-quarantine and new virus spikes elicit further lockdown measures. [chart courtesy US Census Bureau, Bloomberg LP (c) 2020]

WCM Chart of the Week for June 26, 2020

The US Federal Reserve has used the power of its balance sheet to support key segments of US capital markets since early March. Recently, it began to purchase corporate securities including high yield bonds, a move some view as controversial. However, purchasing investment grade (and below) bonds essentially supports companies and ultimately jobs, and full employment is a critical element of the Fed’s mandate. Another beneficial aspect of these purchases is that corporations are making coupon payments and returning principal to the Fed, and that is not necessarily the case with US Treasury purchases. In June, the balance sheet began to shrink, albeit modestly. It peaked at $7.22 trillion on June 10th and currently stands at $7.13 trillion. Following two consecutive weeks of balance sheet declines, stocks have fallen 5.3% as measured by the S&P 500 through June 26. News headlines cite the rise in COVID-19 cases as the reason for recent stock market volatility, but the Fed’s purchasing activity is likely a greater fundamental force dictating the direction of asset prices. Is this a pause or the beginning of a monetary policy tightening cycle? The state of the Fed’s balance sheet is a critical metric that we will continue to monitor. [Chart courtesy Bloomberg LP © 2020]

WCM Chart of the Week for June 19, 2020

Chinese Communist Party (CCP) aggression in the Asia-Pacific region is on the rise. Military tension along the Himalayan border with India resulted in some 20 Indian soldiers perishing this past week. Chinese naval ships have been harassing the Japanese commercial fleet in the East China Sea, and exhibiting similar in Vietnamese, Malaysian, and Indonesian trade routes in the South China Sea. Domestically, the CCP is suppressing Hong Kong freedoms in violation of the 1984 Sino-British Joint Declaration. Globally, the lack of COVID-19 related contrition or even transparency regarding the origin and spread may all contribute to China-related backlash or retaliation. Nearly all Pacific nations have aligned with the US against Chinese aggression. We find it odd that the CCP has chosen hostility in their weakened economic condition, a moment when they really need the rest of the world for their own recovery efforts. Unfortunately, this situation is unlikely to de-escalate anytime soon.  As an example, China’s defense spending is approaching four times India’s and that military show of strength compromises the Asia-Pacific region’s stability and sovereign rights. [source: World Bank and Bloomberg LP © 2020]

« Older posts Newer posts »