Category: Monetary Policy (Page 3 of 3)

WCM Chart of the Week for August 17, 2020

Over the last several months we have cited several factors that, in our view, explain why the US stock market indices have been rising and may continue to do so. The most significant contributors are measures being undertaken by the US Federal Reserve and Federal government to support the labor market. The US consumer has been responding by increasing consumption, and so we see core components of the US economy like auto purchases and manufacturing rebounding. The official unemployment rate is still terribly high, measuring 10.2% in July, but that is a significant improvement over 11.1% in June.

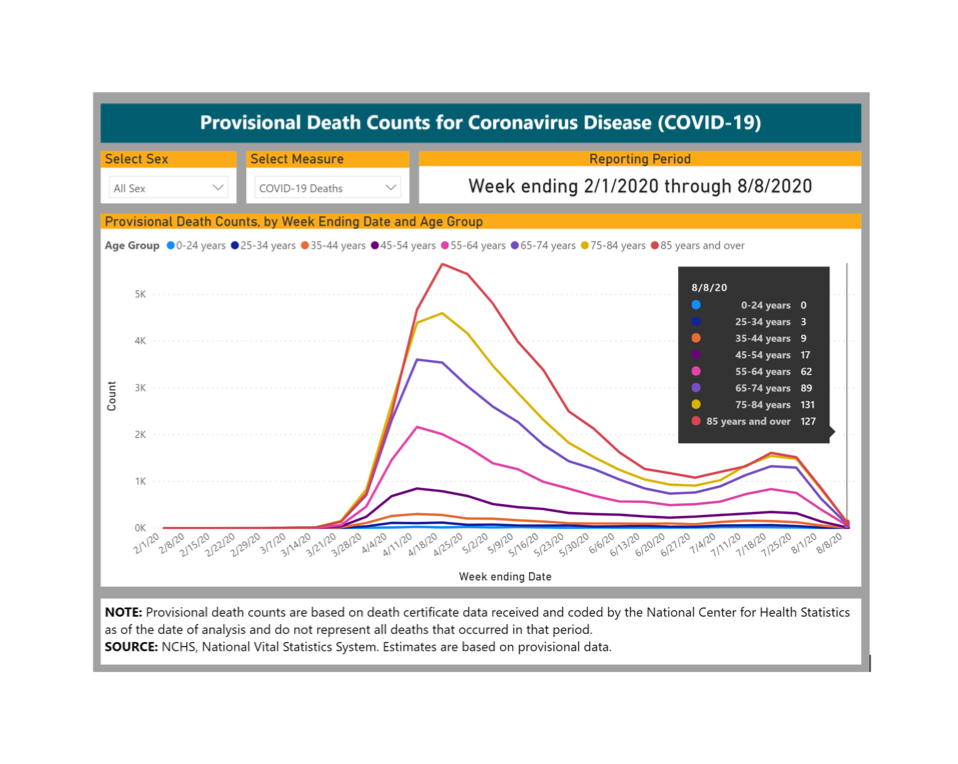
Pandemic-related government-mandated lockdowns are being lifted (although in some areas of the country those being reinstituted) and economic trends should continue to improve as people return to work and to consumption.  Critically, there are encouraging signs related to COVID-19.  According to the National Center for Health Statistics (part of the CDC), weekly total provisional deaths as of August 8th registered 438, lower than the pre-surge figure registered on March 21st. These totals are significantly lower than figures cited by media outlets and Johns Hopkins University, a consequence of how deaths are verified and reported, but most importantly we are seeing improving trends regardless of methodology, and that is a relief.  Very well known yet still necessary to point out, this week’s chart demonstrates the concentration of fatalities for those age 55 and older, showing the terrible risk to and impact on the elderly. But, by contrast, the low concentration and declining trend among the young may alleviate concerns about the upcoming school year and broadening re-openings across the country.

Updates to our monthly newsletter format

WCM has made some changes to our monthly newsletter to make it more engaging and useful for our readers. First, we have moved our interpretive analysis of the month gone by to the front and expanded it. We follow that with our current portfolio positioning and what we see as the capstone risks to our stance. Lastly, we close with a performance survey of capital markets for the prior month, calling out what we see as the most consequential returns which played into both our thinking and our results.

As always, you can find our latest newsletter in the Library, along with an archive of prior newsletters. Thank you for reading!

WCM Chart of the Week for June 26, 2020

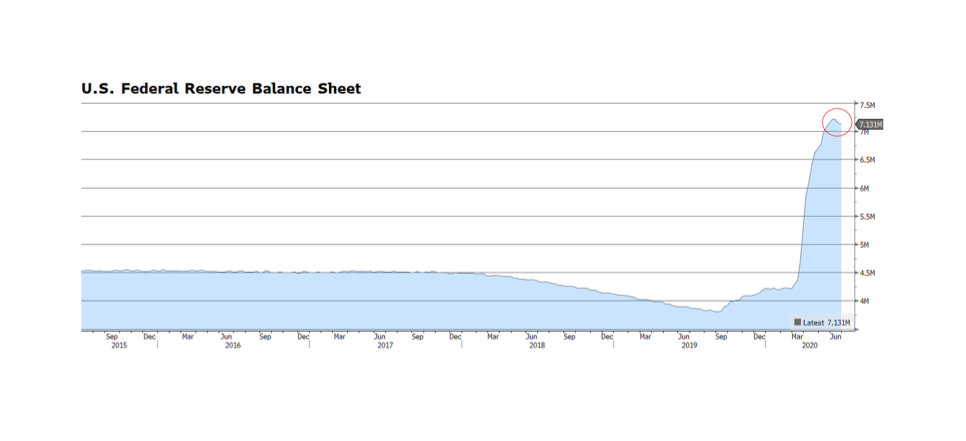
The US Federal Reserve has used the power of its balance sheet to support key segments of US capital markets since early March. Recently, it began to purchase corporate securities including high yield bonds, a move some view as controversial. However, purchasing investment grade (and below) bonds essentially supports companies and ultimately jobs, and full employment is a critical element of the Fed’s mandate. Another beneficial aspect of these purchases is that corporations are making coupon payments and returning principal to the Fed, and that is not necessarily the case with US Treasury purchases. In June, the balance sheet began to shrink, albeit modestly. It peaked at $7.22 trillion on June 10th and currently stands at $7.13 trillion. Following two consecutive weeks of balance sheet declines, stocks have fallen 5.3% as measured by the S&P 500 through June 26. News headlines cite the rise in COVID-19 cases as the reason for recent stock market volatility, but the Fed’s purchasing activity is likely a greater fundamental force dictating the direction of asset prices. Is this a pause or the beginning of a monetary policy tightening cycle? The state of the Fed’s balance sheet is a critical metric that we will continue to monitor. [Chart courtesy Bloomberg LP © 2020]

WCM Chart of the Week for May 8, 2020

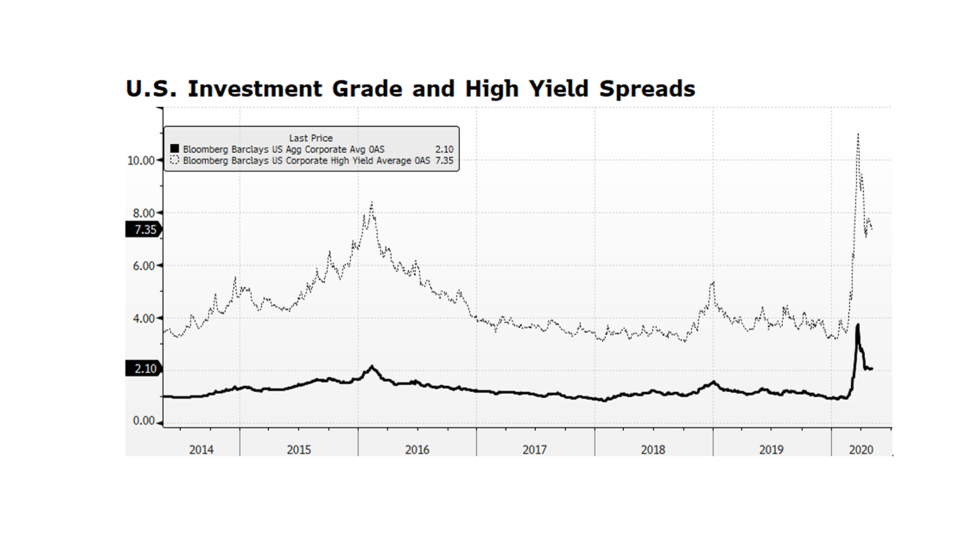
US corporate credit spreads are narrowing, but they are still quite wide by historical standards. Investment grade spreads appear to be stabilizing while high yield (junk bond) spreads are still volatile. Yields premiums in both segments of the credit market have contracted by about half-way from their recent peak on March 23rd compared to their pre-pandemic levels. What we find interesting is that volatility persists in the high yield market given the Fed’s disclosure that they intend to purchase issues and instruments including ETFs within this credit market segment. The volatility is likely a signal that investors expect defaults, insolvencies and bankruptcies. What intrigues us is the potential for Fed purchases of ETFs, because the Fed could opt to receive the underlying bonds, hold them until maturity and absorb any resulting defaults. That would in effect support distressed companies and potentially preserve jobs. It may prove to be a novel way for the Fed to support the labor market using the balance sheet to honor its mandate for full employment. [chart courtesy Bloomberg LP © 2020]

WCM Chart of the Week for May 1, 2020

This past week we witnessed two of the worst US economic reports many of us have ever seen. On Wednesday, it was reported Q1 GDP contracted 4.8% on an annualized basis, and Thursday’s unemployment report brought the total number of newly unemployed to over 30 million, consuming all of the jobs gains since the depths of the Great Recession. But, even with all the bad news on the economic front over the past several weeks, the US stock market as measured by the S&P 500 posted its strongest monthly gain since 1987. At least for now, the stock market is looking beyond the current rut to the potential for prosperity on the other side. That is certainly reasonable considering the amount of monetary and fiscal stimulus being injected into the economy and capital markets as we have been discussing for several weeks. Against this backdrop we are still compelled to ask ourselves what the trigger for re-testing the March equity drop might be. It could be an acceleration of virus cases, a state-level bankruptcy or two, or China-related backlash or retaliation. Current state of mind – hopeful but watchful. [chart courtesy Standard & Poors and Bloomberg LP © 2020]

WCM Chart of the Week for April 10, 2020

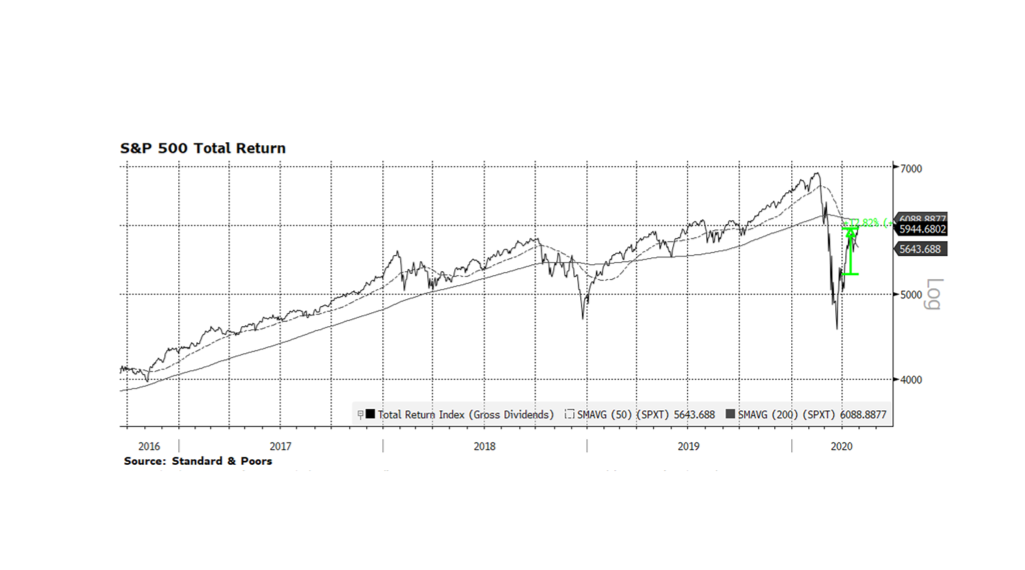
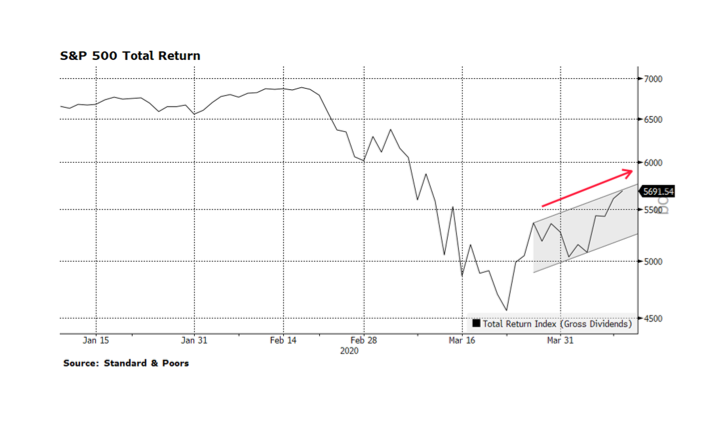
Over the past week we have witnessed encouraging signs in US equities as the three main indexes, the Dow Jones Industrial Average, the S&P 500 and the NASDAQ Composite have come off of their recent lows on March 23 and are making higher highs and higher lows – a key bullish technical pattern.  We are optimistic about US stocks but also understand that we are quite far from containing this health crisis and the recovery in our capital markets remains fragile.

The rout that began in earnest late February has arguably been exacerbated by State and Federal government-led virus containment efforts — business, school, recreational closures as well as encouraging social distancing — that have effectively suppressed the economy.  Throughout history recessions, depressions and bear markets were caused by bubbles bursting like Asian currencies, Dotcom companies, US mortgages, and not by intentional government economic restraint.  Government intervention normally supports economic activity.

Along with roughly $1.8 trillion in asset purchases and other stimulus from the Federal Reserve, The US Federal Government has approved and is now implementing the $2.3 trillion CARES Act directly supporting American families, small businesses and larger corporations. An important aspect of the package is the speed that funds will be sent directly to citizens, anticipated to be just a few weeks.  This is critical considering that over 16 million Americans have filed for first-time unemployment assistance in the past three weeks alone.

Taken together, monetary and fiscal policy stimulus surpasses $4 trillion being injected into the American economy which could represent greater than 20% of GDP.  At the same time, large swaths of the US economy remain virtually frozen as COVID-19 infection rates peak.  There is nothing in modern history like this tension between top-down support and restraint to compare and judge an outcome, but in the longer term we believe support will win out. [Chart courtesy S&P and Bloomberg LP © 2020]

WCM Chart of the Week for April 3, 2020

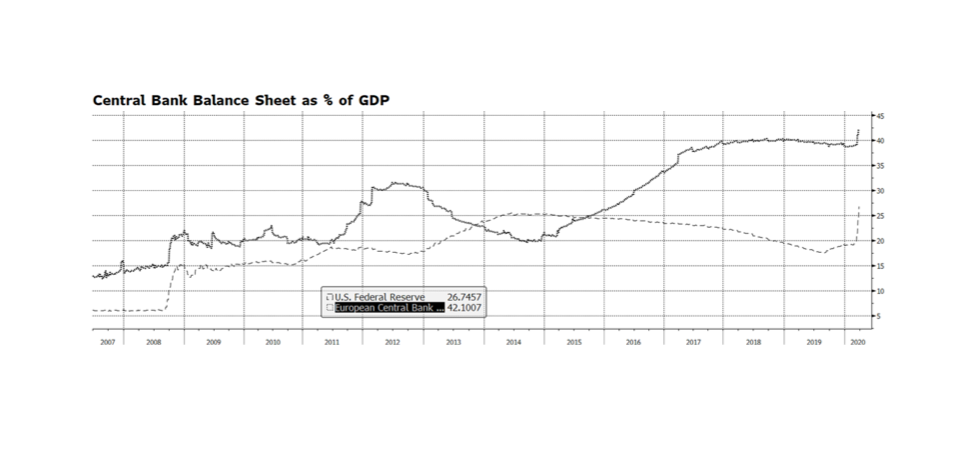
The US Federal Reserve has taken several powerful steps in recent weeks ranging from lowering policy interest rates, intervening in credit markets to provide stability and re-engaging in asset purchases, also known as QE. The amount of monetary stimulus is unprecedented and staggering. Since March 4, the Fed’s balance sheet has expanded nearly $1.6 trillion through their asset purchase plan, accumulating Mortgage Backed Securities, Treasuries and Corporate Credit. That is an incredible amount of expansion in such a short period of time considering that it took some 15 months during the financial crisis from when the QE program began to reach an equivalent level of assets. Some are concerned that the Fed has expended all of its monetary tools and that is a real concern given policy rates are at or near zero. The balance sheet now stands near $5.9 trillion, a level that just a few years ago would have seemed unimaginable. But it could become even larger. The Fed’s balance sheet represents nearly 27% of US GDP. By contrast the European Central Bank’s balance sheet stands at over 42% of European Union GDP. The Bank of Japan stands at over 100% of GDP. The Fed’s asset purchase program could even become more active and remain manageable, especially considering the relative vibrancy of our economy compared to Europe and Japan. [chart courtesy Bloomberg LP © 2020]

WCM Chart of the Week for March 16, 2020

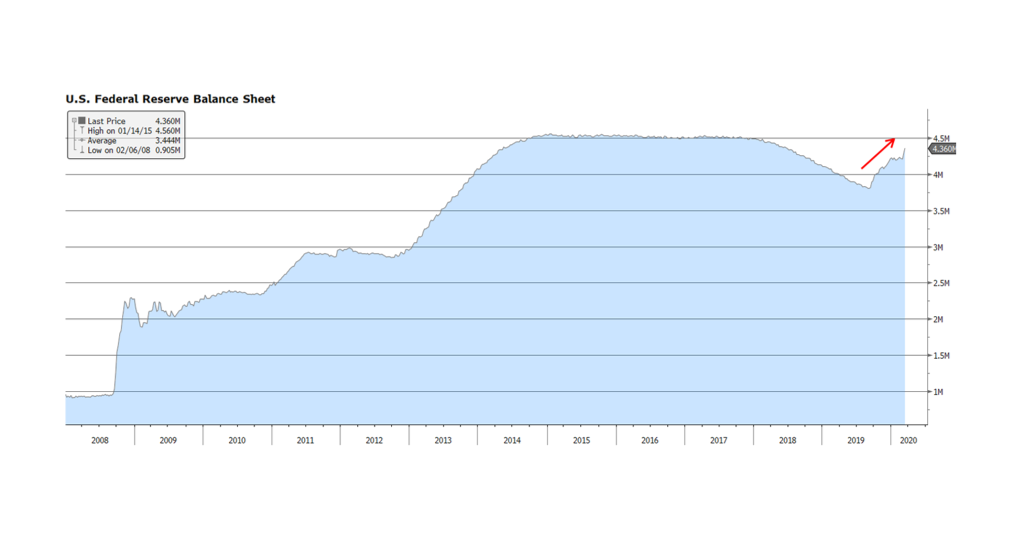
On Sunday, March 15, 2020 after an emergency meeting, the US Fed announced that it was lowering the US Fed funds target rate by 100 basis points to a range between zero and 0.25%, and that it will expand its bond holdings by at least $700 billion.  The expansion of the Fed’s balance sheet, depicted in this week’s chart, will likely bring it to levels surpassing records reached in the aftermath of the Financial Crisis.  Hyper accommodative measures being undertaken by the Fed (and other central banks) are occurring simultaneously with aggressive fiscal measures being enacted by the Trump administration and the US Congress.  The magnitude of the fiscal and monetary spending underscores the degree of uncertainty regarding the economic and social impact of the COVID-19 virus.  What had been a robust economic and fundamental backdrop in America just a few short weeks ago will likely turn out to be a low-growth to stagnating to contracting-growth environment during the current quarter and likely the following quarter.  The economic downshift beyond the Summer is a major question mark and will be dependent on the efficacy of containment measures, potential seasonal dormancy of the virus, and successful treatments and outcomes. [chart courtesy Bloomberg LP © 2020]

The view from here

In these last hours before the US markets open for this week’s sessions, here are a few more thoughts we have shared in our community.

Global markets finally caught up, in the negative sense, to China’s stock markets as worries about the COVID-19 “novel” coronavirus spread to the developed West faster than the disease itself. A contagion of concern overtook markets and left us with a week of returns we have not experienced since the Financial Crisis in 2008. What is materially different from our perspective is that this correction is not a response to a lack of faith in the system itself. During the Crisis, securities prices collapsed on the fear that it was actually impossible to value many of them, and that large parts of the system were in fact worthless. In certain cases this did prove to be the case as a sudden disappearance of liquidity exposed a large quantity of bad loans and mortgages that had been ingested by major financial institutions, causing the collapse of systemically important operations like Lehman Brothers, Bear Stearns, Washington Mutual and Countrywide. There was absolutely widespread panic that we could be facing a new Great Depression as the financial system itself seized.

This past week was very different. As we have previously explained, COVID-19 of course has and will continue to have economic consequences, but it does not call into question the soundness of markets, banks and whole economies as we experienced a dozen years ago. We find it likely that the response to the virus will impact company earnings and the GDP of nations. Shutting down the 2nd largest economy (China) for weeks if not months would never have gone unnoticed and unpriced. Reasonably, that demands revisiting what companies are worth and whether yesterday’s prices reflect tomorrow’s realities. Prior to the outbreak, fundamentals were reasonably solid around the world. Not boom, but certainly not bust. The situation we find ourselves in could take that optimism down to modestly solid, or perhaps slightly weakened. But even a mild global recession triggered by this moment does not call into question the fundamental underpinnings of finance and commerce. We are seeing steep and sudden drops in stock markets that remind us of 2008, and nearly unprecedented lows in interest rates, without anywhere near the breakage that brought about those kinds of corrections historically.

So, in a word, why? We see a few different forces at work which all feed our collective response to unconstrained uncertainty. Emotion, namely fear, is always a powerful motivator. Fear of the virus, fear of losing money, reasonably make people want to be safe. 2008 still looms large in the minds of investors and a PTSD-type response is not out of character. Fool me once, shame on you. Fool me twice, shame on me.

That emotion is being fed by a toxic brew of real, or worse, real but incomplete, data without framing or context, and quite a lot of false narratives. Add to that the markets are now patrolled and exploited by algorithms and artificial intelligence engines that can actually capture and quantify shifting sentiment and strong moves one direction or another in prices, and exploit or even amplify or aggravate those moves for profit. We have seen numerous isolated examples of this played out in the “Flash Crash”, the “Fat Finger”, and other moments over the last many years which show how quickly and to what extremes things can break loose on little information or bad information. Throw something at the market like the novel coronavirus and we could experience those types of extreme (over)reactions again and again.

We anticipate that clarity and greater understanding around the virus’ pandemic qualities and impacts will help markets firm up, and would not be surprised to see a fair price for securities settle at something less than the peaks from just a couple weeks ago after accounting for the drag from lowered economic activity. It is also our expectation that we will see some manner of coordinated global response across the major central banks to compensate not for falling stock prices but for potential lost GDP from less commerce, less travel, and less work. Depending on the magnitude of the response this could put a floor in prices, or at least slow the descent and tamp down volatility while investors regain their footing.
WCM Chart of the Week for November 25, 2019

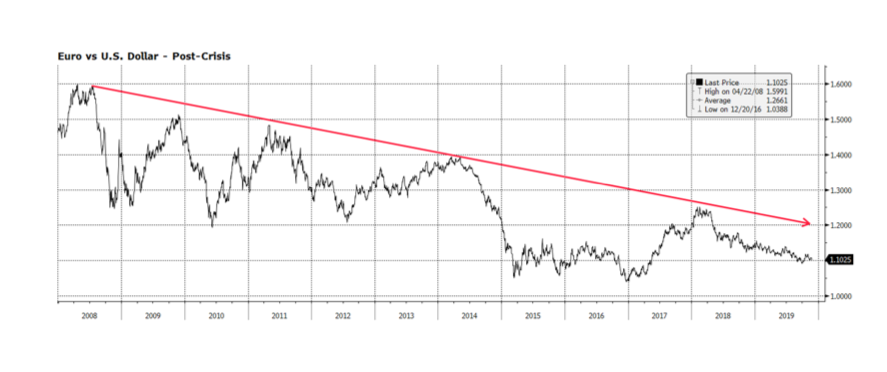
Christine Lagarde has taken the helm at the European Central Bank from the highly regarded yet somewhat controversial Mario Draghi at the beginning of November.  While many view Draghi’s leadership as forcing the ECB to the limits of monetary policy, he was successful in maintaining the monetary union and the single currency at several critical points in time over the past decade.  Lagarde faces a formidable challenge inheriting a central bank that is divided in the direction of policy. Her legacy as a consensus builder may prove invaluable at this pivotal point in time.  In her debut speech last week, she emphasized the need for stronger domestic demand and fiscal policy in order to counter the evolving global trade balance.  If she is successful in convincing countries with budget surpluses to spend and invest through fiscal stimulus, the region may see stronger economic activity and a firmer Euro which has been in a downtrend versus the US Dollar since the financial crisis.  The world needs a stronger, more resilient Europe and we believe Christine Lagarde will be an ideal leader of the ECB. [chart courtesy Bloomberg LP © 2019]

Newer posts »