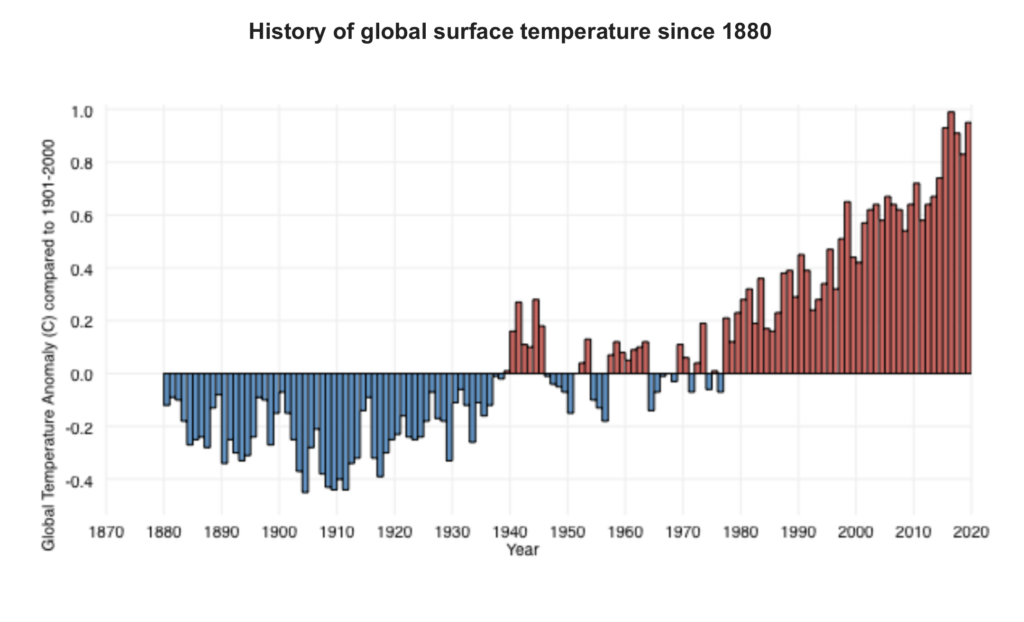
As we close out Climate Week, we need to check in on global temperature. It is climbing. Climate scientists, environmental advocates, legislators, etc. have taken to talking about “climate change” because there has been so much rhetorical pushback about “global warming”. But as the data shows, global average annual temperatures are demonstrably higher as compared to the long-term average over the last century, and decisively trending higher from the pre-Industrial period. In finance we use charts that look like this to argue the benefits of investing in stocks. Trend followers would consider this a definitive and stable factor. Climate change is the outcome and global warming is the driving factor. From a capital markets point of view a professional investor would be derelict for ignoring this data. Scientists still believe mean reversion is possible if we withdraw greenhouse gases (GHGs) from the system. Prudent investment involves deploying capital for mitigation – the reduction in GHGs to reduce climate volatility – and resilience – improving infrastructure, businesses and communities to be able to handle or ideally prevent climate-related damage. [chart courtesy NOAA, August 2020 – https://www.climate.gov/news-features/understanding-climate/climate-change-global-temperature]
“Global warming: the long-term heating of Earth’s climate system… due to human activities, primarily the burning of fossil fuels, which increases heat-trapping greenhouse gas levels in Earth’s atmosphere,” (Shaftel, 2020). The term coined decades ago has gained momentum in not only scientific communities and environmental organizations, but political campaigns and industry corporate governance policies around the globe. From polar ice melting and sea levels rising to extreme weather events, our changing climate has far reaching and compounding effects on the environment and ecosystems, our economies and industries, and our global food supply. One of the direct effects of climate change and global warming is ocean acidification.
To examine the process of ocean acidification and its impacts on human life, recall an adolescent science lesson on pH and water chemistry. The pH scale runs from 0-14, with 7 being neutral. Higher than 7 represents a basic or “alkaline” pH and lower than 7 represents an acidic concentration. For reference, household vinegar, an acidic liquid, has an average pH of 2.5, while tap water has an average pH of 7.5. The ocean’s current pH is approximately 8.1, which is basic (NOAA, 2020). How does the ocean’s pH tie into global warming and climate change?
The ocean naturally absorbs roughly 30% of the carbon dioxide that is released into the atmosphere. When seawater and carbon dioxide combine, carbonic acid is produced, lowering the pH of the ocean and increasing the acidity. As levels of carbon dioxide increase due to human activity (burning of fossil fuels, land-use change and deforestation, agricultural industries) the amount of CO2 absorbed by the ocean also increases. Plainly speaking, the more CO2 we produce and release into the atmosphere, the more acidic our oceans become. Since the Industrial Revolution in the 1700’s, increases in CO2 have resulted in a 30% increase in ocean acidity (NOAA, 2020). This present acidification process is occurring ten times faster than any previous changes over the last 300 million years (IUCN, 2017). The rapid acceleration of CO2 production significantly jeopardizes the ability of ecosystems to effectively adapt to the changes in ocean chemistry.
Increased ocean acidity especially affects organisms with calcium carbonate shells or skeletons including shellfish like coral, oysters, crab, and lobster. A recent study performed by the National Oceanic and Atmospheric Administration on the pteropod, a small sea snail integral to the ocean food chain, showed that the levels of ocean pH projected for year 2100 dissolve the organism’s shell within just 45 days. Furthermore, researchers have already discovered severe shell dissolution in pteropods naturally found in the Southern (Antarctic) Ocean, indicating the process’ rapid progression (NOAA, 2020). The pteropod snail is a major food source affecting members of the food chain from krill and fish to whales and seals. When we consider how each organism is interconnected in the food web, the loss of one species creates a cascading effect.
Unfortunately, the consequences do not stop there. Increased acidity has also been linked to a disturbance in scent transmission, inhibiting species from detecting predators and locating suitable habitats (NOAA, 2020). Acidification has also been observed to affect sound transmission, reducing sound absorption and increasing the ocean’s ambient noise (OAN). Increases in OAN can impair marine animals’ hearing and communication, increase stress and lower their immune systems, and even cause brain hemorrhaging or death in severe cases (Gazioğlu, 2015).
High Level Impacts
In 2018, the global fishing and seafood sector represented a USD 164 billion international trade industry employing 59.5 million people. 88% of the 179 billion tonnes of total fish produced in 2018 was for direct human consumption. Fish and fish products supply approximately 3.3 billion people with nearly 20 percent of their average per capita intake of animal protein. Furthermore, seafood provides many crucial nutrients to the human diet including long chain Omega-3 fats, iodine, vitamin D, iron, calcium, zinc, and other minerals. With key species like the pteropod in jeopardy, the entire seafood industry risks significant threat, exacerbating global hunger and malnutrition (FOA, 2020). Dying coral systems lack the ability to effectively buffer coastal communities from storm waves and erosion, and leave those communities to suffer consequences to tourism and commercial business (IUCN, 2017). Profits, careers, economies, biodiversity, ecosystem structure, shoreline integrity, and global food supply are all threatened if ocean acidification continues to accelerate due to increased CO2 production.
As managers of sustainable and responsible investment portfolios, our passion lies not only in providing ethically sourced returns for our clients, but in supporting positive impact-driven companies and communities. Conscious investing is achieved through selective avoidance of institutions that harm ecosystems or using the allocation of capital as a lever to change those institutions, in conjunction with focusing on institutions that provide regenerative and resourceful solutions to humanities’ needs.
Gazioğlu, C., Müftüoğlu, A. E., Demir, V., Aksu, A., & Okutan, V. (2015). Connection between Ocean Acidification and Sound Propagation. International Journal of Environment and Geoinformatics, 2(2), 16–26. https://doi.org/10.30897/ijegeo.303538
We are very proud to announce that we are joining forces with HealRWorld, Angels.Inc., and the SDG Impact Fund as the lead advisor for two new donor advised funds (DAF). Each DAF is driven by a specific mission to direct capital in pursuit of the United Nations Sustainable Development Goals. The first DAF, the HealRWorld SDG Impact Fund, is focused on improving access to financial resources to fuel business and capital formation and catalyze growth for women- and minority-led small businesses. According to MPAC Solutions, a scant 1.3% of $70 Trillion of institutional capital is allocated to women and diverse management teams. The HealRWorld fund is raising capital through the charitable structure to make mission- and program-related investments in these small businesses that demonstrate strong ESG attributes and an orientation toward attaining one or more of the SDG targets. HealRWorld’s proprietary data and analysis has demonstrated that small businesses with strong ESG attributes are up to 3X more credit worthy than the typical small business, making them both good businesses and good risks.
The fund will also make strategic investments in community- and small business-oriented targets, both through lending and taking equity stakes, in order to further align investment with mission and amplify the potential outcomes from capital raised in the DAF, as well as bring coinvestment capital to the table to multiply the available resources for these businesses.
Equally exciting is the Angels.Inc SDG Impact Fund. The Angels.Inc fund is focused on funding media projects and ventures that are contributing vastly to innovation for the betterment of society and our future as well as contributing to our well-being, mental health and amplifying the positive messages and goals of the United Nations Sustainable Development Goals (SDGs). The investment mandate for the Angels.Inc. fund is more expansive than the HealRWorld fund, committing to investing in the same small businesses, but will also invest in and fund media-related targets consistent with Angels.Inc’s “Media For Good” mandate.
For more information or to make a commitment to these amazing charitable efforts geared at empowering and ennobling business and media to lift up and serve everyone equally and inclusively, please visit our Philanthropic Services page, email the Funds at funds@healrworld.com, email us at contact@wildecapitalmgmt.com, or call us at 866-894-5332.
Every member of an eco-system, from vegetation to predator species, plays an integral role in the sustainability of that system. When one player is removed from the hierarchy, whether by result of climate change, pollution, human development, or natural occurrences, the effects are cascading. An often overlooked and yet essential vulnerable group of species is pollinators. Although bees and fruit bats are not the poster children for endangered species like tigers and elephants, their role in pollination facilitates an ecological process critical for the reproduction of wild flora and agricultural crops.
(c) 2020 P. Sorgi
According to the U.S. Department of Agriculture, more than 150 crop species in the United States, including blueberries, tomatoes, apples, bananas, and peaches, rely on pollinators annually. Alfalfa and other grain crops necessary to sustain livestock also rely upon pollination. Furthermore, more than half of the world’s diet of fats and oils are produced from animal-pollinated plants (sunflowers, almonds, canola, avocados). Honeybees alone are responsible for pollinating $15 billion in crops for the U.S. economy each year (Main, 2020). Plainly speaking, without pollinators, the globe’s future food security collapses.
Without pollinators, you can drop the dinner table conversation because there quite literally won’t be a dinner
So, where does the issue reside? According to Penn State University’s Center for Pollinator Research, since 2006, the honeybee population in the United States has declined 30-42 percent each year largely due to the impacts of climate change, habitat loss, and toxic pesticide use. Of the 65 species of flying foxes (fruit bats), 31 are threatened with global extinction (Vincenot, 2017). Protecting species of pollinators is not just the “right thing” to do; it’s compulsory for human existence.
As managers of sustainable and responsible investment portfolios, our passion lies not only in providing ethically sourced returns for our clients, but in supporting positive impact-driven organizations. Conscious investing is achieved through avoidance of institutions that harm ecosystems, in conjunction with focus on institutions that provide regenerative and resourceful solutions. [artwork (c) 2020 P. Sorgi]
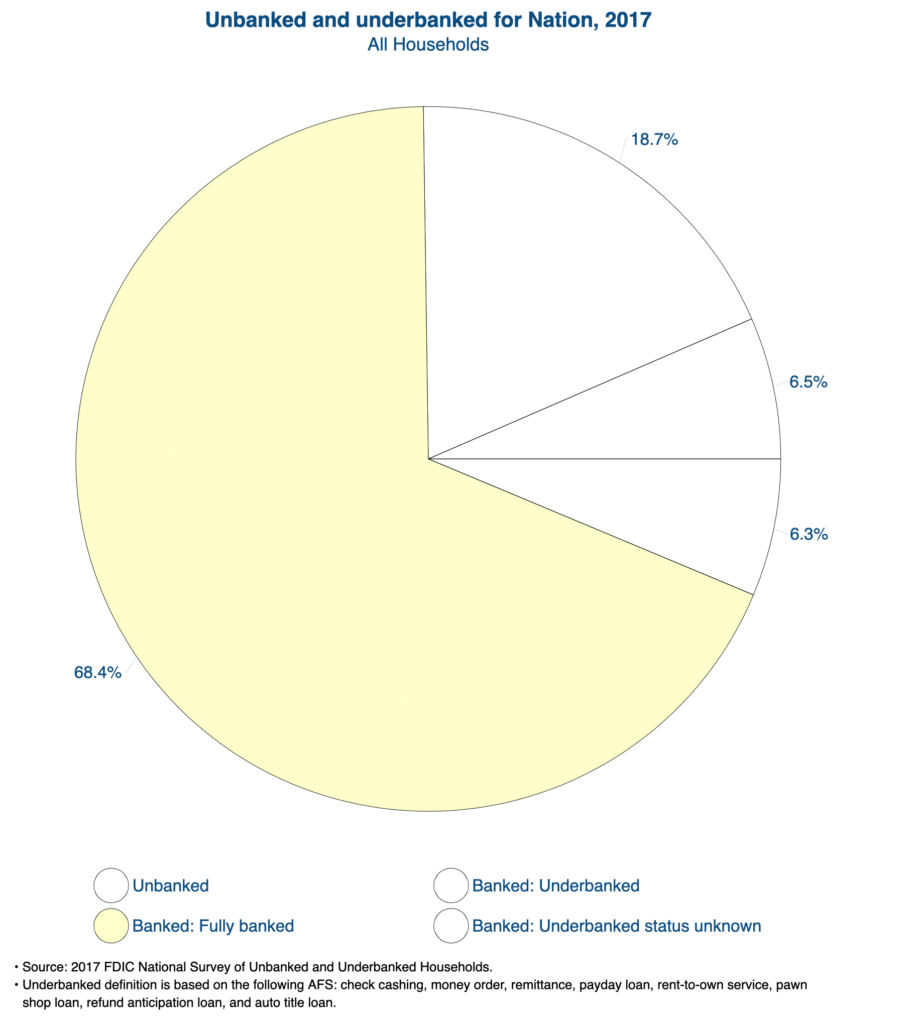
Economic fault lines run deep across America. Many of these lines have been laid bare as a consequence of the economic crisis unleashed by the COVID-19 outbreak, but the lines were there long before, and will continue long after. Those sitting on the bottom rungs of the prosperity ladder not only were among the most vulnerable as business, trade and service ground to a halt, they are in the worst position to participate in the recovery. Access to capital is critical to household and business formation, maintenance and growth. As recently as 2017, the last time the FDIC released its biennial national survey, 18.7% of American households were underbanked (relying on payday lenders, rent-to-own, pawn shops, refund anticipation loans, and other non-bank resources), and a full 6.5%, or nearly 8.5 million households, were completely unbanked. Without access to the financial infrastructure enjoyed by nearly 70% of the population, the road ahead will be difficult if not impossible, and investing in community financing through CDFIs and other non-traditional conduits will be critical to an inclusive recovery.
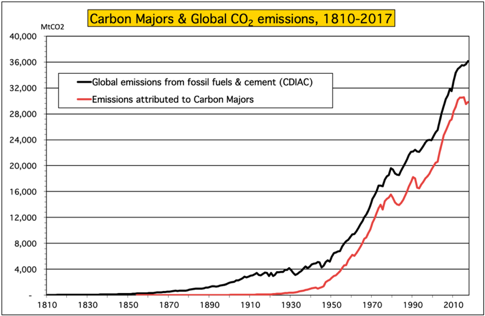
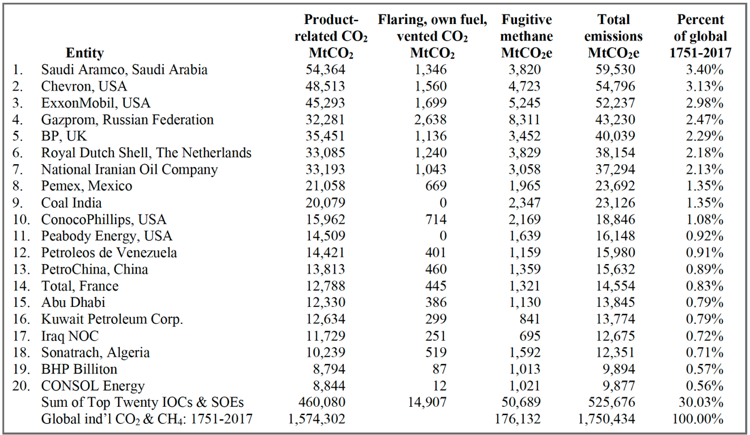
More and more companies, including airlines and oil companies, are announcing an intention to achieve carbon-neutral operations over the next couple decades. But, it is important to look behind the headlines and understand what that sort of pledge actually means. What business is the company actually in and does the pledge include their supply chain or product output? From the Climate Accountability Institute (Oct. 9, 2019, data through 2017), global fossil fuel and cement emissions from 1965 to 2018 totaled 1,354 billion tonnes of carbon dioxide and energy-related methane (GtCO2e); The twenty largest investor-owned and state-owned fossil fuel companies produced carbon fuels that emitted 35% of the global total (480 GtCO2e); Looking over the entire historical data set they find their current database of 103 fossil fuel and cement entities emitted 1,221 GtCO2e, or 69.8% of global since 1751 (1.75 TtCO2e); of which the Top Twenty companies are responsible for 526 GtCO2e, or 30% of all fossil fuel and cement emission since 1751. [Charts and data, Climate Accountability Institute, October 2019]
Climate Accountability Institute, October 2019Climate Accountability Institute, October 2019
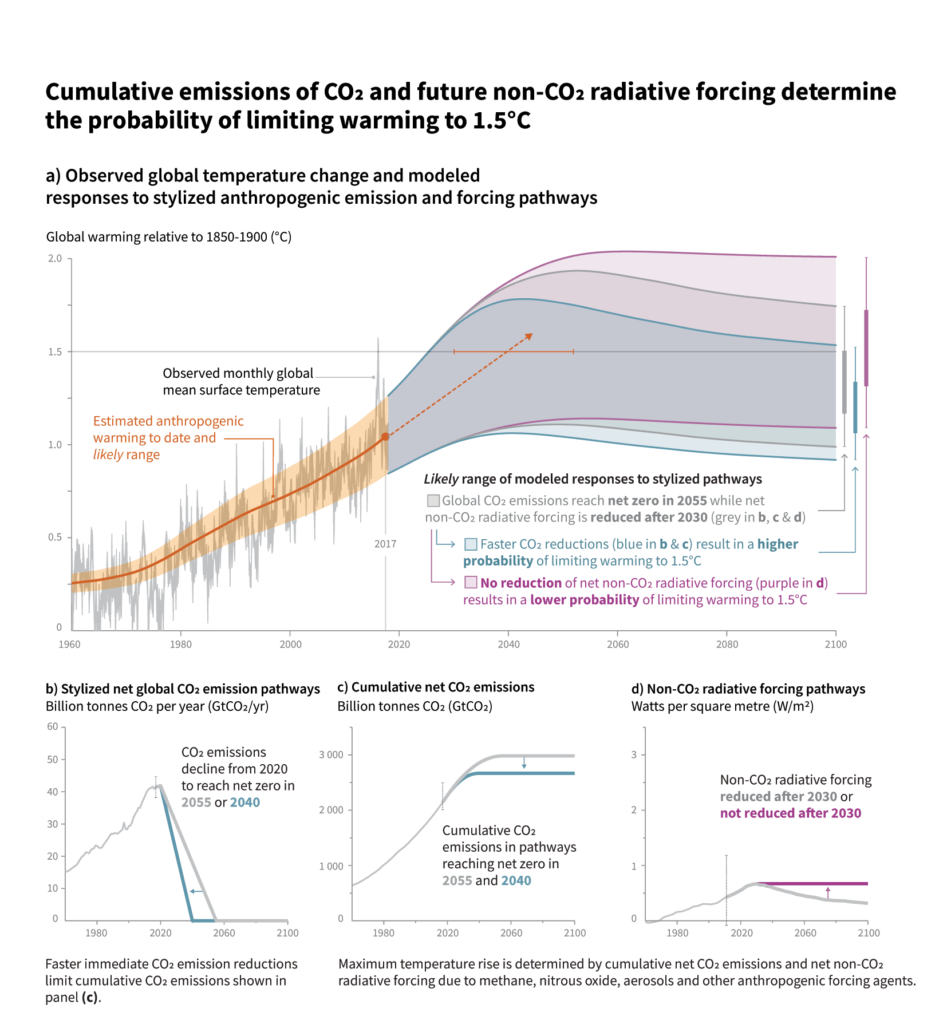
A 1.5 degree Celsius rise in global mean surface temperature over pre-1900 levels is considered to be a critical threshold above which environmental systems start to break down and serious and durable damage from climate change to the world around us really takes hold. 2 degrees is recognized as a tipping point where the damage is both catastrophic and irreversible, at least in terms of human timelines. This week’s chart is from the Intergovernmental Panel on Climate Change (IPCC) and shows us where we have been, and a possible range of temperature outcomes 80 years out, if we reduce anthropogenic (human-caused) CO2 emissions to zero over various time horizons. Even the best case projections, assuming aggressive and immediate emissions reductions, have us only leveling off around 1 degree over 1900, more or less where we find ourselves today. From a capital markets point of view this tells us two things – first, a best case means a continuation of much of what we have been experiencing with extreme climate events and therefore climate resiliency must be factored into risk assessments and securities pricing for equities, real estate, infrastructure, natural resources and bonds in the public and private sectors. Second, if we don’t turn the corner, the system will run away from us, mitigation will no longer be an option and asset prices will be jeopardized globally. Even being motivated solely by profit and loss this challenge is existential to the capital markets and must be addressed.
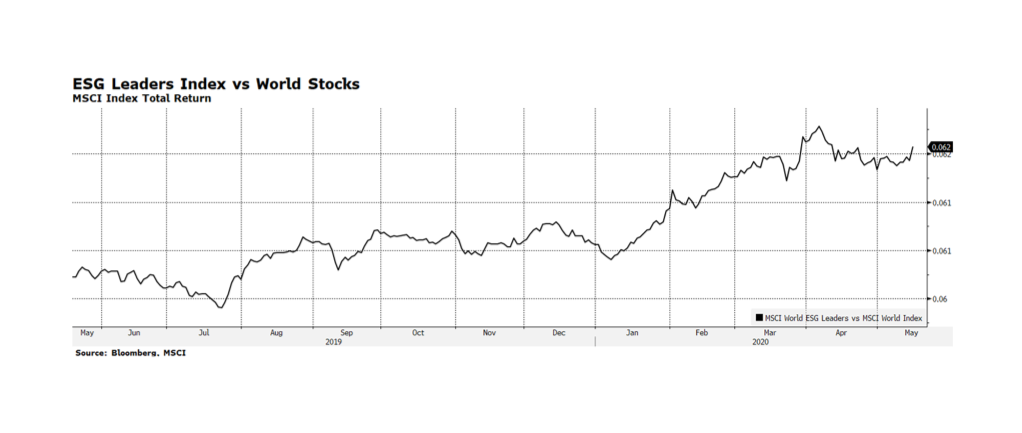
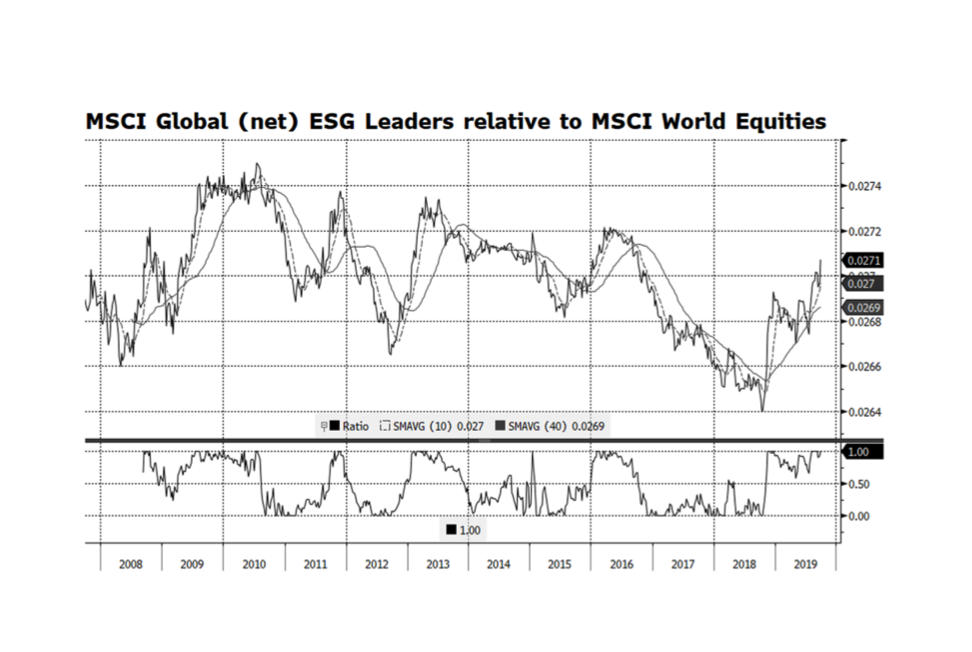
On the last day of Climate Week, we shift our focus from where we started with bonds to conclude with global equities. One of the tired old tropes that gets trotted out for people who have not looked at the data is that ESG-oriented strategies are structurally disadvantaged and destined to underperform. Of course, every strategy follows its own course based on benchmarks, PM decisionmaking, trading effectiveness, and a variety of other factors. But if we take the discretionary elements out and just focus on index comparisons, we do not find any persistent lag or advantage. Yes, performance varies somewhat in the short term.
Sometimes ESG leads, sometimes it lags. Over market cycles though, these small variations sort themselves out and you end up in the same place. MSCI, one of the world’s preeminent index authorities, has maintained an ESG Leaders series of equity indices that start in 2007. According to Bloomberg, since the inception of the global ESG Leaders Index (on September 28, 2007) through September 26, 2019, the ESG index total return is 72.4% compare to 71.3% for the global equity index, or annualized total returns of 4.64% and 4.59%, respectively. This week’s chart shows this relationship graphically and there do appear to be cycles of outperformance as well as underperformance of the ESG index. However, this is considerably exaggerated by the scale of the chart as the differences measure in fractions of basis points.
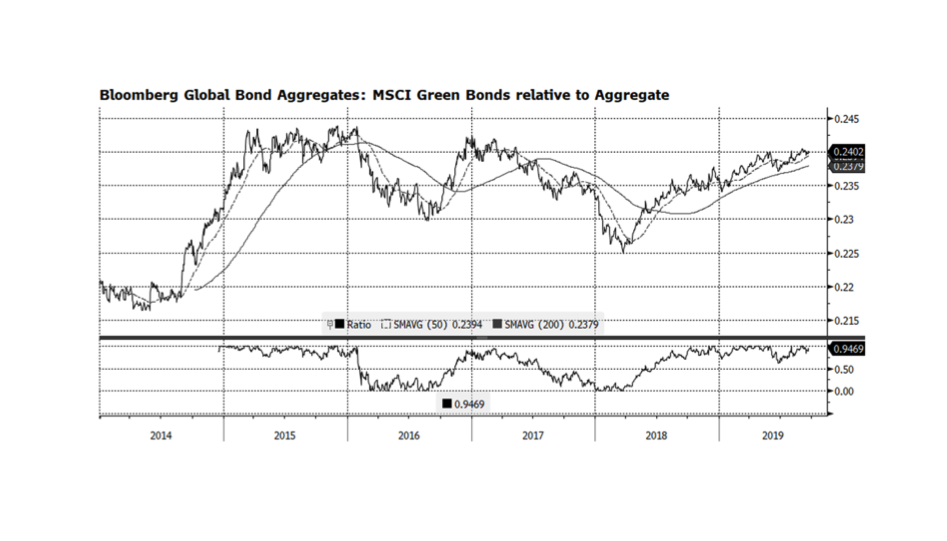
On this convening day for the UN Climate Action Summit, we take a fresh look at the benefits of climate-centric fixed income investment strategies. There is a persistent myth that disciplined ESG investing dampens investment performance, which we believe is short sighted. This week’s chart examines the total return properties of the Bloomberg Barclays MSCI Global Green Bond Total Return Index versus the Global Aggregate equivalent index. The green bond Index is based on issuers that adhere to the Green Bond Principles which include energy efficiency, renewable energy, pollution prevention and control, sustainable management of land and natural resources, potable water and wastewater management, and clean transport among other critical green activities. What this relationship shows us is that there are periods when the green index underperforms and also periods when the index outperforms the broader aggregate index. This index started at the end of 2013, so we have nearly seven years of data to evaluate. According to Bloomberg, over that time frame (as of September 20, 2019), the green index is up 22.3% compare to 12.2% for the global aggregate or annualized total returns of 3.6% and 2.0%, respectively. Clearly, over the longer term, green-oriented fixed income investors have done well by investing in issues that are doing good as compared to the overall global bond market. [Chart courtesy Bloomberg LP (c) 2019]