Category: ESG (Page 3 of 5)

The clock is ticking. What does that mean for investors?

Another trip around the sun leading to another Earth Day, our second of the pandemic. Amid all the trauma, last year we got a brief glimpse of what hitting the pause button on our use and overuse of the planet would yield. Fresher air, cleaner water, wildlife in the canals and in the streets. We conducted an unintended (and unwanted), all-in global experiment, and graphically demonstrated that the environment does have the capacity to respond to behavioral change on the part of humans.

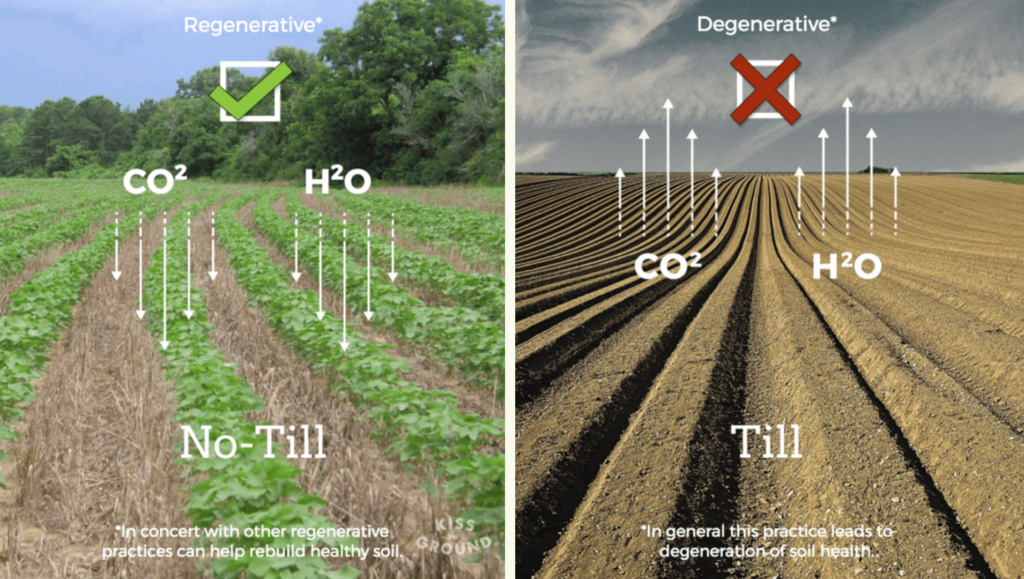
Stopping everything isn’t the answer. But changing everything could be. This planetary test case provided strong evidence against the argument that global systems are too vast and too complex, and changing human patterns wouldn’t result in any sort of improvement. A change from extractive to regenerative processes in food, energy, materials, housing, and transportation among others not only can help address the challenge of sufficiency but also manage our footprint so we live with rather than just on Earth. There is still time to stop and possibly even partially reverse the mounting damage to atmospheric, oceanic, littoral, arborial and other global systems. The risk of not taking those steps is existential for humanity, and it is also bad capitalism. Wildfire, inundation, desertification, loss of pollinators, extreme weather, even glacial collapse have real economic consequences from interrupting supply chains to destroying value in the billions and trillions of dollars.

Moving to more regenerative businesses and communities will mitigate or even prevent some of these risks from manifesting, and will be more equitable and inclusive and result in more financial opportunity for individuals and entire markets. The best possible investment is one that both reduces risk and catalyzes growth at the same time. Caring for the planet we live with is also the best possible free option to get on that trade.

#TurtleIsland

WCM Chart of the Week for April 19, 2021

We can’t leave Women’s History Month completely in the rear-view mirror without taking a long and hard look at how impossibly difficult it is for women founders to obtain venture capital funding for their early-stage enterprises. COVID-19 was certainly no friend either, leaving 2020 as the worst year in the last five for women. As compiled by Crunchbase (news.crunchbase.com), a paltry 2% of funding went to women-led startups in 2020, a figure which obnoxiously more than quadruples to 9% with a male co-founder but is still an embarrassment.  The system is not just biased – it is broken. There is no credible case that can be made that, out of a universe comprising more than half the world’s population and representing more than half of the Associates, Bachelors, Masters AND Doctorates awarded just in the US, women barely represent even one fiftieth of the economic potential of men to investors. Next time the question is asked about how we continue to grow the global economy and unlock the full potential of the capital markets given all the headwinds we face, give this answer – Invest. In. Women… Now. And particularly invest in black, indigenous, and other women of color. [chart from Crunchbase News, © 2020]

WCM Chart of the Week for March 15, 2021

UN SDG 5 – “Achieve Gender Equality and Empower All Women and Girls”. During Women’s History Month we again turn our attention to equal access to economic opportunity for women in the American workforce. COVID has further exposed one of the ongoing issues with fair and equal compensation, which is the wage gap between women (and particularly women of color) who are mothers and men who are fathers in the same roles. The National Women’s Law Center gathered data pre-pandemic (2018) assessing the compensation picture for frontline occupations which turned out to be the exact roles hurt worst through the last year of COVID, including housekeepers, retail, wait staff, childcare, home health and nursing. Between 15 and 35% are working mothers, and of those as much as 74% of color. The gap between working mothers and fathers ranged from 36 cents down to 13 cents per hour. That is a bit of an abstraction. This week’s chart, taken from the NWLC and the 2018 American Community Survey, illustrates that gap much more starkly in real dollars on an annual basis, and points to the downstream economic drag on food, housing, education, job training and other expenditures and investments families make for healthy living and vibrant communities and economies.

WCM Chart of the Week for February 8, 2021

What does a pledge from China of carbon neutrality by the year 2060 actually mean, and how do we measure progress? There are various global targets for climate change mitigation that attempt to quantify what needs to be done so that the global system does not exceed the point of no return, generally seen as a rise of 1.5 – 2.0 degrees Celsius. Under the Paris climate accord, a number of nations committed to carbon neutrality in the next 30 years. China said 40, but as the largest economy on Earth how do we measure their progress? This week’s chart from the US Energy Information Administration country analysis of China (Sept. 2020) is just one hint at the structural challenges China faces in achieving the target. On a per-capita basis China’s carbon footprint is still smaller than the developed West, but their total footprint is more than a quarter of the world’s total output, and their energy mix is just 15% non-carbon and more than half coal. After the pandemic interruption that marked the period around the Lunar New Year, China’s carbon output returned to or even exceeded pre-pandemic levels. We are looking for the steps China will take now to level out carbon growth so that it can begin reversing the trend after 2030, and wonder, even worry whether another 10 years of increasing output takes us past the global point of no return.

Pine beetles and self-reinforcing climate consequences

Beetle Kill in Colorado (c) 2020 J. Sorgi

By September of this past year, both California and Colorado had experienced record-breaking wildfires, exceeding previous history for the largest wildfires in their respective states. According to the National Interagency Fire Center, more than 7.5 million acres had burned across the United States by Fall 2020, surpassing the approximate 6.1 million acre 10-year annual average (NIFC, 2020). Why have we seen increasingly disastrous wildfires in recent years?

Enter stage right the mountain pine beetle. Approximately 5 mm in length with an average life span of one year, the mountain pine beetle may not seem like a formidable opponent, but like all ecosystems, each member is densely interconnected (USDA FS, 2011). An imbalance of one species always equates to consequences for another.

One of 17 species of bark beetles native to North America, the mountain pine is a wood-boring insect that has shaped the forest landscapes from Canada to Mexico for thousands of years (NPS, 2018). From July to August, adult pine beetles colonize forests in search of larger trees (typically no less than 3 inches in diameter). Affected pine species include Lodgepole, Ponderosa, Western White, Whitebark, Jack, and Limber pine. Once a suitable host has been identified, female beetles excrete a pheromone signaling other beetles to follow (Katz, 2017). Females then begin eating tunnels called galleries into the inner bark of the tree, extending up to 30 inches or more from the attack site. The eggs hatch and beetle larvae continue burrowing and feeding until winter freezing temperatures trigger dormancy. By June or early July, larvae pupate and emerge from the tree in search of new hosts to repeat the cycle. Within one year of invasion, infested trees can fade from green to red-brown and die (USDA FS, 2011).

Continue reading

WCM Chart of the Week for February 2, 2021

It is not surprising that China’s carbon emissions are growing given relatively strong economic activity compared to the developed world. Or perhaps it is given China’s pledge of carbon neutrality by the year 2060. China’s contribution to carbon in our atmosphere is approaching 10 billion tons annually, an amount that is greater than the US and Europe combined. To place that in context, according to the World Bank, as of 2019 the Chinese economy is only 38.6% of US and EU economic output. It is important to note that carbon output in the US and Europe has been steady and even declining as their economies are expanding. Another startling fact is the Chinese economy represents 16.3% of Global GDP (also World Bank data) and yet contributes nearly 29% of the 34.2 billion tons of carbon emissions, according to the British Petroleum Statistical Review. In our view, China has a great deal to do to meet its 2060 carbon neutrality pledge on its way to becoming the world’s largest economy, starting with action on its COP21 Paris commitments including reducing its dependence on coal.  [chart courtesy British Petroleum Statistical Review, © 2021]

WCM Chart of the Week for January 4, 2021

What happens when one ESG priority comes into conflict with another? This week we examine a chart from the World Resources Institute (www.wri.org) of data from the Servicio de Información Agroalimentaria y Pesquera chronicling a decade of growth in avocado production in Mexico. Avocados play on ESG themes of healthy eating, job creation and economic opportunity. Unfortunately, the explosion of consumption, primarily in the US as a result of NAFTA, of Mexican avocados has fueled deforestation, draining of aquifers, soil degradation, increased CO2 emissions, threatens indigenous species and even triggers small earthquakes. According to various studies assembled by the World Economic Forum, avocado groves consume multiples of the water of indigenous forest, and the fruit has an end-point carbon emissions footprint many times that of bananas. As with other monocultures like palm in Indonesia, avocado has brought economic opportunity to areas that badly need it like Michoacán province, but at a profound and unsustainable cost. Conscientious consumption and deploying capital to find more sustainable methods of cultivation without depriving Michoacán of needed money and opportunity are examples of where ESG is headed to address whole-systems challenges rather than focusing narrowly on single issues or ideas.

WCM Chart of the Week for December 7, 2020

This week we are in the midst of examining the likelihood of a pandemic-induced housing crisis and its effects on families, the economy, and markets.  As we learned during the Financial Crisis, it is a very slow process to foreclose on a mortgagee and remove them from a home, particularly when there is a massive backlog of borrowers in similar circumstances. Renters, on the other hand, are more immediately vulnerable to eviction and subsequent homelessness. This week’s chart from econofact.org illustrates the percentage of households suffering a moderate or extreme cost-burden of rent (30% to 50% of income) by household income tier. These observations are pre-COVID, so we can reasonably expect this picture to be much worse in 2020. Government-issued moratoria on evictions kept people in their homes but also shifted the economic burden to the literal doorstep of landlords, many of whom are small businesses. As those edicts roll off but the pandemic still rages in the coming months, landlords will of necessity pursue their economic and business interests and housing insecurity will jump. Whether it is on the backs of the landlords or the renters, the social and economic consequences of this income and housing crisis will play out in our communities, in the real economy and in the investment markets for some time to come.

WCM Chart of the Week for October 19, 2020

Wildfire has had profound implications both for and because of climate change, for ecosystems, for communities, and for public health and safety. Wildfire has also had major economic consequences. Loss of housing, loss of commercial space, loss of public infrastructure, loss of crops, and loss of tourist revenue all add up to tens of billions of dollars a year just in the United States. The risk of wildfire conspiring with a lack of adequate governance and safety practices led to devastating financial losses and convictions on 84 counts of manslaughter for one of the largest utilities in the country. This week’s chart is from Munich Re and NatCatSERVICE by way of the Insurance Information Institute showing wildfire losses over the last decade (expressed in millions). Note that the spike in 2017 was so significant that the data from prior years is swamped by scale. While 2019 appears to have been a more modest loss year on par with earlier in the decade, according to the National Interagency Fire Center (nifc.gov) as of October 19th this year nearly twice as many acres have burned as by the 19th of last year, on pace with 2018 and 2019. The tale has yet to be written but that would suggest another likely spike in insured and uninsured losses. Economic loss is as much about the incidence of wildfire as it is the private encroachment on wild spaces. People increasingly work, farm and live in vulnerable forested and grassed spaces based on a history of relative fire scarcity that no longer exists. Without addressing both the climate systems issues to mitigate fire risk, and the resiliency of communities and businesses in the face of more frequent and prevalent fire, economic losses will continue to climb.

WCM Chart(s) of the Week for October 12, 2020

The popular, if you can call it that, view of rising carbon levels in the atmosphere is that the carbon problem is primarily an industrial problem. Oil, coal, and gas extraction and refining, power generation, factories, automobiles, chemicals, concrete, do all contribute to atmospheric CO2, and the trajectory of climate consequences tracks well with the Industrial Revolution. But what is far less well understood, but may be of much greater consequence, is global soil health. Modern agriculture, driven by feed lots, monocultures, tilling, chemical pesticides, and off-season bare soil has been systematically eliminating healthy soil as a global carbon sink. From an economic perspective what is really stunning is that these practices actually don’t result in more profit and productivity per acre for farmers. This week’s images are from Kiss the Ground, an initiative to help the world transition (back) to regenerative agriculture, which is better for both planet and profit. Become a soil advocate at www.kisstheground.com, and check out the documentary now streaming on Netflix. #kissthegroundmovie

« Older posts Newer posts »