Category: Consumer (Page 2 of 2)

WCM ESG Week — Theme 4: The Business of Human Trafficking

“It’s really important that people begin to understand and have transparency when making purchasing decisions as consumers… what high-risk businesses are. When you are paying X, Y, or Z for a shirt or an outfit, there are people sacrificing their lives to bring it to that cost level.” (Bongiovanni, WCM ESG Week, 2021). In 2016, an estimated 40.3 million people were living in some form of modern slavery, whether through sex or labor trafficking or domestic servitude. Although declared illegal in almost every country, human trafficking or modern slavery persists at deplorable rates, even within developed nations like the United States.  No community is immune, and no age, race, gender, or nationality is exempt from being exploited. Traffickers often use violence, manipulation, or false promises of high-paying jobs or romantic relationships to entice victims into trafficking situations. They target vulnerable individuals who may be experiencing economic hardship or emotional or psychological distress, or who may live in areas of natural disaster, political instability, or civil unrest (Homeland Security, 2020). In the United States alone, the FBI estimates over 100,000 children are victims of sex trafficking. Children in the foster care and welfare system are particularly vulnerable due to a lack of family support and stability. 60% of child sex trafficking victims recovered through FBI raids in 2013 were found to be on record in the foster care or group home systems (NFYI, 2015). But, our youth are not the only individuals at risk.

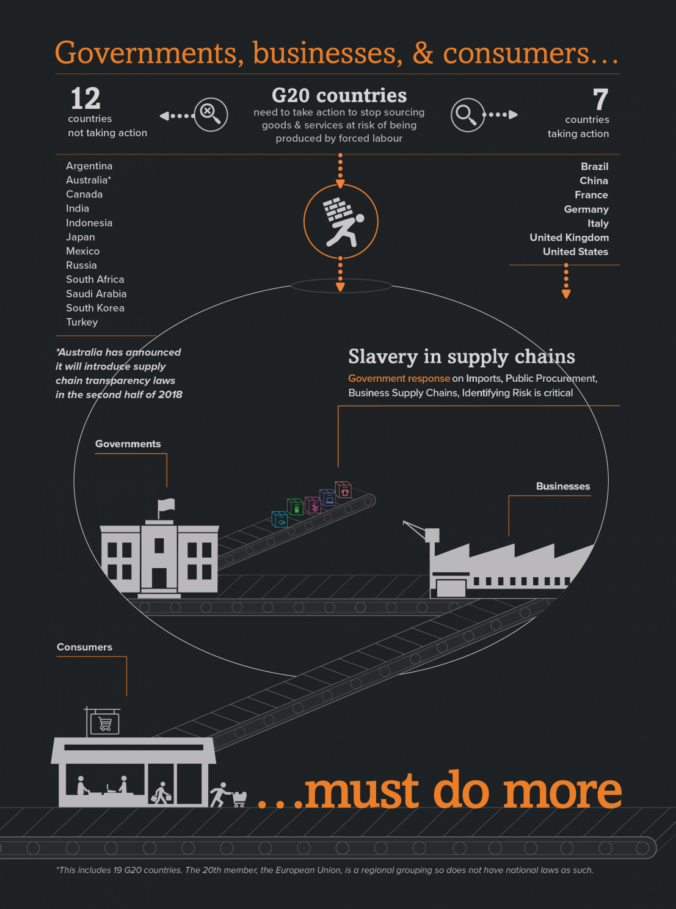
Globally, 46% of human trafficking victims are adult females, 19% young girls, 20% adult males, and 15% young boys. Human trafficking can take on many forms including forced marriages, prostitution, and domestic servitude. Trafficking even infiltrates private and public supply chains through forced labor and debt bondage, many within the sectors of construction, manufacturing, agriculture, mining, fishing, and forestry. Collectively, G20 countries (the intergovernmental forum comprising 19 countries and the European Union aimed at addressing major global issues) are responsible for importing $354 billion worth of at-risk products each year. The top products, by each country according to US dollar value include apparel and clothing accessories, sugar cane, coal, fish, timber, and laptops, computers, and mobile phones. Disappointingly, only seven G20 countries have formally enacted laws, policies, or practices to halt business and government sourcing goods and services produced by forced labor (Global Overview, 2020).

So, what can we do as consumers and investors to ensure that we do not contribute to or support the exploitation of “human capital”? “One of the most important first steps to addressing the problem is discovery and disclosure. Transparency will assist a variety of stakeholders, from customers and business partners to investors and lenders, to make more intelligent decisions about deploying capital. The end goal is to change how companies build those supply chains and wring slavery out of the system” (Sloss, 2019). Tune into our podcast WCM ESG Week Day 4: The Business of Human Trafficking with Michele Bongiovanni of HealRWorld and Distributed Data Network as we discuss the issue of human trafficking, its widespread and fundamentally objectionable consequences, its interwovenness in the Developed West, and what actions are being taken to weed out and eliminate trafficking within our supply chains.

https://nfyi.org/issues/sex-trafficking/

https://www.dhs.gov/blue-campaign/what-human-trafficking

https://www.unodc.org/unodc/en/data-and-analysis/glotip.html

https://regenerativeinvestmentstrategies.com/wp-content/uploads/2019/11/Citywire-USA-September-2019-Breaking-Free.pdf

https://www.globalslaveryindex.org/

WCM Chart of the Week for May 17, 2021

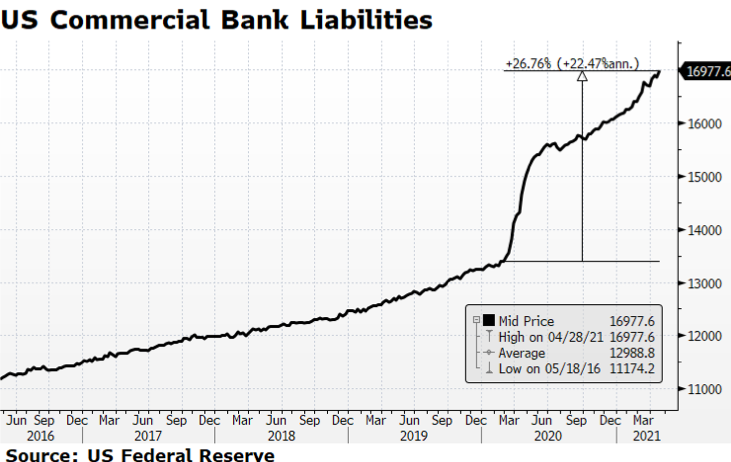
According to the US Federal Reserve, growth in the money supply, widely described as M2, peaked at nearly 27% at February’s month end reading and as of March it registered a 24% annual clip. To place those figures in context, the pre-pandemic average annual growth rate of M2 over the preceding 20 years [February 2000 – February 2020] was 6.1% according to Fed data. The previous peaks in M2 growth never surpassed 10.3%. Put another way, the entire US money supply, from the birth of our nation to now, expanded by around 25% in the past year alone.

This tremendous amount of additional liquidity is tied to quantitative easing and the numerous fiscal stimulus plans that have delivered direct payments to individuals and families that, for the most part, landed in bank deposit accounts. Commercial Bank Liabilities, the equivalent of consumer deposits, have swelled some 26% since the beginning of the pandemic, indicating that stimulus recipients have fortified savings as opposed to increasing spending. The good news is that consumers are in better shape than they have been in several years. The bad news, if it can be considered that way, is that there is likely pent-up demand that could ultimately fuel inflationary concerns.

The most recent annual headline inflation figure (CPI) reported by the US Bureau of Labor Statistics for April was 4.2%, well above the consensus of 3.6% and over two times the Fed’s target rate. Our main concern is whether the recent upward trend in prices is reflationary or a more enduring inflationary trend. The Fed has stated that it considers current price conditions to be “transitory” and thus falling into the reflationary category. [chart courtesy Bloomberg LP © 2021]

WCM Chart of the Week for May 11, 2021

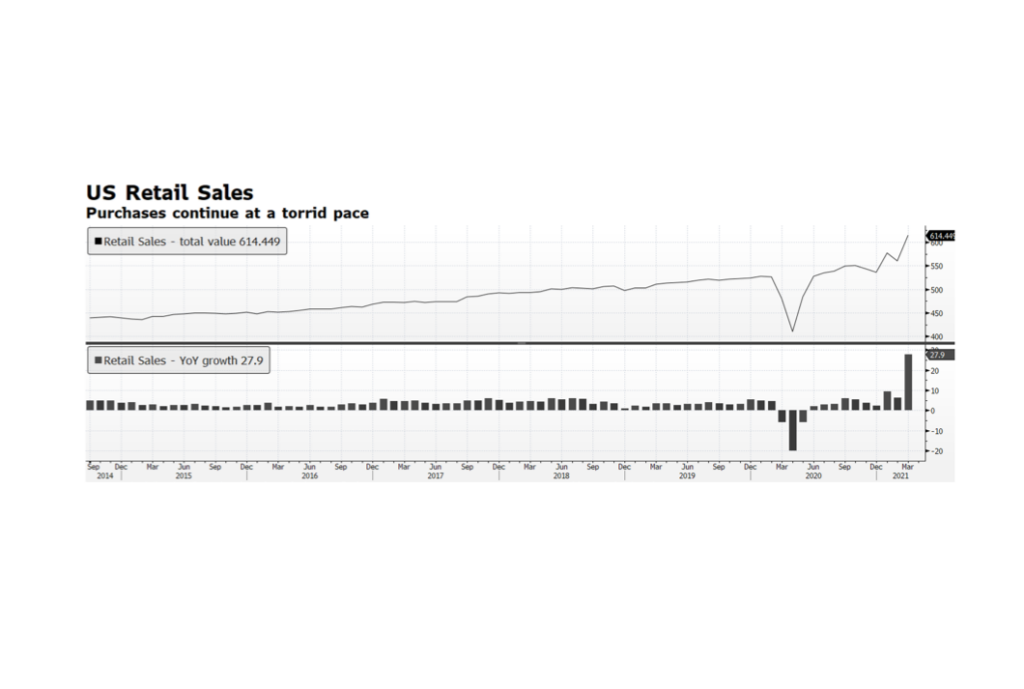
The US Census Bureau’s latest survey of retail sales will be reported on May 14th. The Bloomberg survey of economists’ average forecast is for a 1.0% monthly gain, adding to March’s torrid 27.9% annual pace. March’s level of over $614 billion in purchases is nearly 17% higher than the pre-pandemic level of $525.8 billion of February 2020. Consumption, the most dominant portion of the US economy, is clearly rebounding and could further stoke inflationary concerns. This is occurring as hundreds of billions of US fiscal stimulus dollars have yet to be fully deployed with potentially more on the way on top of elevated commodity prices, shortages in building materials and the labor force far from full employment levels. The Fed remains committed to QE, in effect managing the entire yield curve, and has publicly stated that it will tolerate higher inflation. But for how long? Market pressures may force the Fed to act sooner than they currently plan and that could be a major shock to the system. [chart courtesy Bloomberg LP © 2021]

WCM Chart of the Week for August 21, 2020

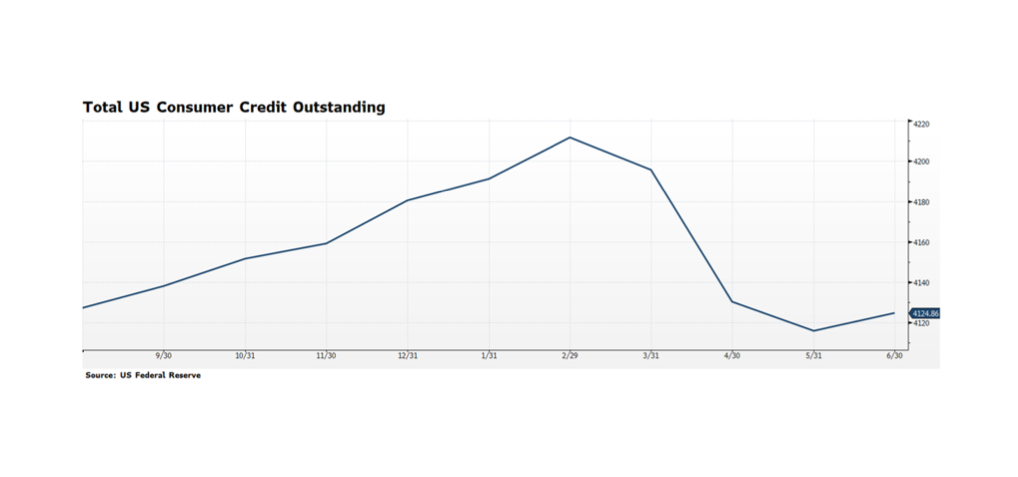
A few weeks ago we discussed US consumer trends, citing the elevated personal savings rate as reported by the BEA, in addition to citing expanding personal consumption. The relatively high personal savings rate suggests that there could be pent-up consumer demand to put that money to work. This week’s chart highlights total consumer credit outstanding, which has declined considerably since its pre-pandemic peak at the end of February. The decline in personal balance sheet leverage suggests that American households can access credit as needed or desired. This data is not very timely as June 30 is the most recent report, but it does suggest that the consumer is not as distressed as in previous recoveries.

The labor market continues to be the most restraining issue facing the economy — 14.8 million continuing jobless claims with initial claims amounting to 1.1 million this past week. But, the Bureau of Labor Statistics reported July payroll jobs expanded in 40 states, declined in one and were essentially flat in the remaining nine. We do need a broader and more inclusive jobs recovery because, as the BLS reports, the large increase in average hourly earnings is not good news — It reflects lower-paid workers being pushed out of the work force due to COVID-19 related business suspensions and closures. Strengthening trends in housing and manufacturing should spur further job growth and help restore this disenfranchised segment of the workforce. [Chart courtesy US Federal Reserve, Bloomberg LP (c) 2020]

WCM Chart of the Week for August 7, 2020

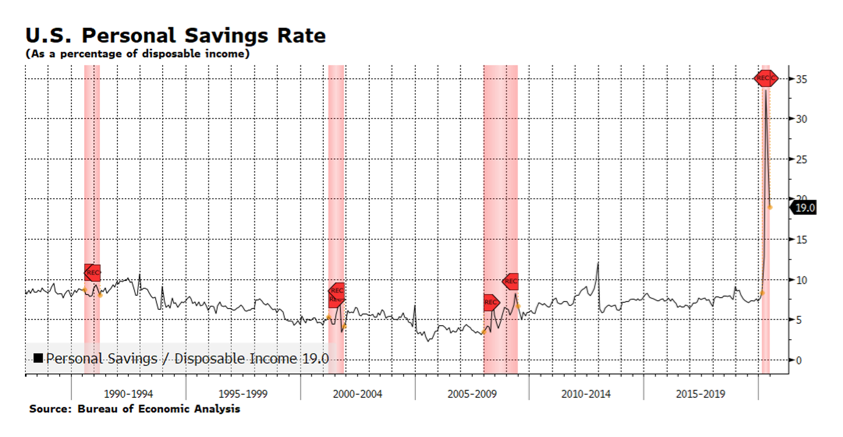
According to the Bureau of Economic Analysis, Americans are saving their disposable income at unprecedented levels. The savings rate is persisting well above previous peaks reached during recessionary periods spanning nearly 35 years. Americans are sitting on their wallets for obvious reasons – fears of the coronavirus, government mandated lock-downs and broad feelings of economic insecurity. The overall rate, while declining steadily since its April peak of 33.5%, stands at a level that is two to three times the percentage of previous recessions. That suggests to us that there is pent-up demand that could help bring the economy out its current nadir. Personal spending has been rebounding, with June’s monthly figure climbing 5.6%, building on May’s 8.5% advance. We call attention to the fact that the June report beat expectations while May was revised upward. There is still a tremendous amount of uncertainty related to COVID-19, terrible stress in the labor market and the upcoming national elections in the US, but the American consumer is a powerful economic force that may prove to be spring-loaded. [chart courtesy BEA and Bloomberg LP © 2020]

WCM Chart of the Week for July 20, 2020

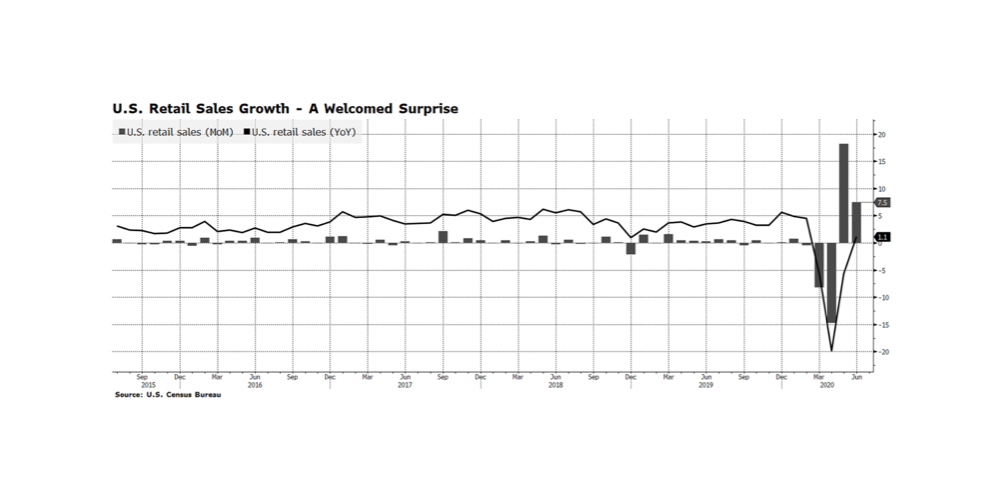
On Thursday, July 16th, the US Census Bureau released Retail Sales figures and month-over-month growth registered a nice surprise — 7.5%, well above the consensus estimate of 5.5%. The prior month’s figures were also revised upward.  We see this as an obvious reflection of the reopening of the US economy and pent up demand.  But, we don’t read much into the positive monthly gain versus the consensus estimate because economists have never had to forecast under conditions that can be considered “lock-down uncertainty”. What we do find encouraging and more interesting is that the reported annual growth rate was 1.1%.  At this time last year the US economy was on firm footing, and yet Retail Sales are modestly above those levels today. While the trajectory of sales growth is a relief, we would not be surprised to see some sluggishness emerge as we collectively digest the flurry of initial purchasing pre-quarantine and new virus spikes elicit further lockdown measures. [chart courtesy US Census Bureau, Bloomberg LP (c) 2020]

Newer posts »