Category: China (Page 1 of 2)

Charting COP-26, Take 2, November 3, 2021

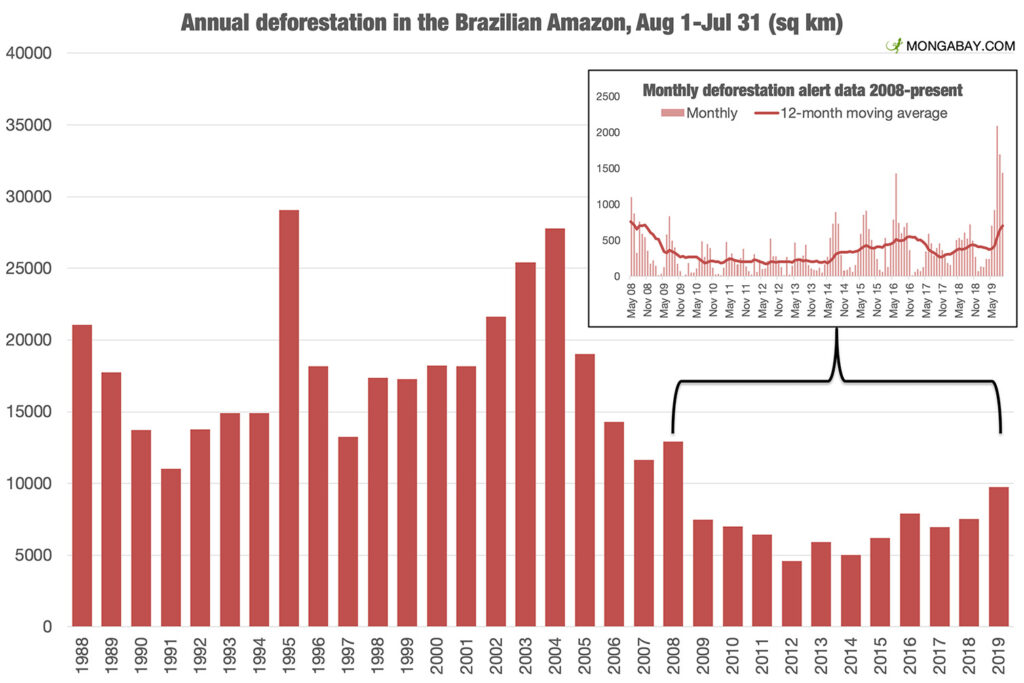
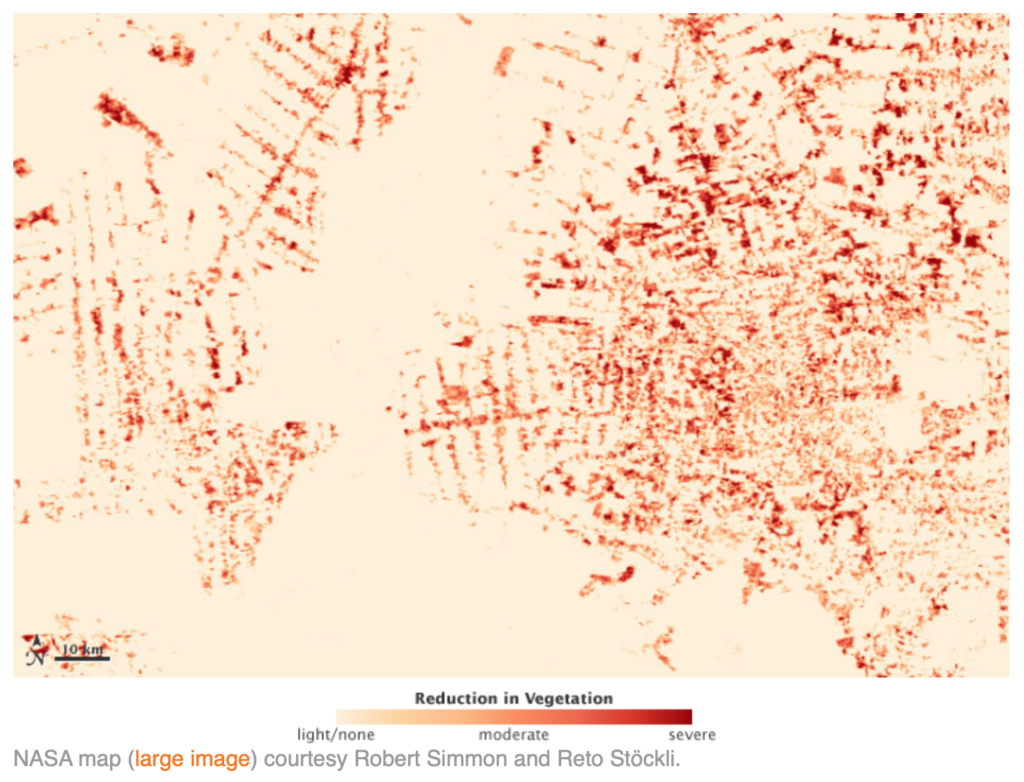
Jair Bolsonaro isn’t there either. While the President of Brazil is not in attendance, the country is still represented, but one is forced to wonder what the degree of commitment is when the boss chooses not to attend for “strategic” reasons. On the positive side of the ledger, even with Bolsonaro’s absence Brazil signed on to the pledge between 100 signatory countries to end deforestation by 2030. And reinforcing our point about the real action being with private enterprise and not with government, dozens of global financial services companies also are committing to discontinue investment in and financing for businesses and other concerns engaging in or profiting from deforestation. Today’s charts look at the trends and patterns in Amazonian deforestation. Brazil made great positive strides over the past decade dramatically improving over the prior twenty years. However, with Bolsonaro’s election we observe a significant jump in activity in 2019, and expect similar increases in 2020 and 2021 (not yet reflected in the data). The second chart from NASA provides a visual representation of reduction in vegetation in the Amazon in a period between 2000 and 2008 to illustrate the patterns of destruction. Ironically, note that the pattern looks like leaf veins, propagating from main roads to local roads and spreading out into the forest until larger and larger tracts of land are cleared. Crops like soy account for much of the native vegetation cleared, and one of the biggest importers of Brazilian soy in the last couple years is China. No Bolsonaro. No Xi. Starting to see a pattern there too? 

WCM Chart of the Week for September 13, 2021

We are back, but maybe China is not. China’s purchasing manager index for exports has signaled a decline since April’s reading of 50.4 (a reading below 50 suggests a deterioration in conditions). This data series is interesting in the current inflation debate because it is a barometer of global trade and aggregate demand. If demand is weakening while headline consumer and industrial prices remain elevated, that suggests that the supply/demand balance is being dominated by supply-related issues. This could make sense given the numerous instances of supply chain bottlenecks, transportation issues, etc. that we have discussed and that continue to make headlines. Consequence for the markets — this may be another reason why the Fed may be dovish for longer. [chart courtesy Bloomberg LP (c) 2021]

WCM Chart of the Week for June 1, 2021

On Monday, China’s Politburo, the CCP’s top decision-making body, announced that all married couples could have up to three children along with expanded government support for child rearing and education. It is widely speculated that this is driven by deteriorating demographics in China. In this week’s chart we observe the continued and accelerating upward trend in the 65+ age group versus China’s total population. The Wall Street Journal reported that the prime working age population (citizens between the ages of 15 and 59) has declined from 70.1% in 2010 to 63.35% in 2020. Age distribution is critical to economic vitality and notoriously difficult to alter and in China, the one child policy that was lifted in 2016 may have created a new norm because it lasted so long. The effect may be a permanently lowered replacement rate. We can’t help but find it ironic that the directive comes from the Politburo which is dominated by 60+ year old men (we could only find one female on its current roster). Another significant point that Peter Orszag, a widely respected former Washington budget official, notes in his Bloomberg opinion piece of May 11th, a declining Chinese population could mean lower carbon emissions, which is material since China’s total carbon footprint exceeds that of the entire OECD combined (27% of global GhGs). [chart courtesy Bloomberg LP © 2021]

WCM Chart of the Week for May 25, 2021

The US Fed and European Central Bank (ECB) continue to pursue aggressive quantitative easing while the two dominant Asian central banks, the Bank of Japan and the People’s Bank of China, have slowed their securities purchases so far this year. The ECB’s activity is of particular interest, not only because of the size of the balance sheet ($9.2T, €7.6T), but the pace that it has expanded over the course of the past year. The ECB’s monetary support continues at a critical time as the EU economy appears to be emerging from the pandemic-induced slump. Lock downs are slowly being lifted and infection rates are plunging from the March and April spikes. Another promising (gradual) trend emerging is in sovereign interest rates in the region, which appears to be an indication of stronger economic activity in the months ahead. [chart courtesy Bloomberg LP (c) 2021]

WCM Chart of the Week for March 8, 2021

According to the widely followed Shanghai Shenzhen CSI 300 Index, Chinese equities have abruptly fallen into correction territory, declining over 12% from their near-term peak on February 10th. The consensus is the correction was overdue given extended valuations of the dominant companies in the index. Historically, Chinese share prices have been volatile but tolerant investors have been rewarded with strong relative returns. However, this rout is concerning because market participation within China has been declining since late Summer 2020. Chinese equities did help lift share prices across Asia, broadening the global stock market rally beyond just US technology companies. But, we are now seeing some of the flipside of this correlation as price action in Chinese stocks is adversely impacting broader Emerging Market equities which have been among the world’s top performing assets so far this year. [chart courtesy Bloomberg LP © 2021]

WCM Chart of the Week for February 8, 2021

What does a pledge from China of carbon neutrality by the year 2060 actually mean, and how do we measure progress? There are various global targets for climate change mitigation that attempt to quantify what needs to be done so that the global system does not exceed the point of no return, generally seen as a rise of 1.5 – 2.0 degrees Celsius. Under the Paris climate accord, a number of nations committed to carbon neutrality in the next 30 years. China said 40, but as the largest economy on Earth how do we measure their progress? This week’s chart from the US Energy Information Administration country analysis of China (Sept. 2020) is just one hint at the structural challenges China faces in achieving the target. On a per-capita basis China’s carbon footprint is still smaller than the developed West, but their total footprint is more than a quarter of the world’s total output, and their energy mix is just 15% non-carbon and more than half coal. After the pandemic interruption that marked the period around the Lunar New Year, China’s carbon output returned to or even exceeded pre-pandemic levels. We are looking for the steps China will take now to level out carbon growth so that it can begin reversing the trend after 2030, and wonder, even worry whether another 10 years of increasing output takes us past the global point of no return.

WCM Chart of the Week for February 2, 2021

It is not surprising that China’s carbon emissions are growing given relatively strong economic activity compared to the developed world. Or perhaps it is given China’s pledge of carbon neutrality by the year 2060. China’s contribution to carbon in our atmosphere is approaching 10 billion tons annually, an amount that is greater than the US and Europe combined. To place that in context, according to the World Bank, as of 2019 the Chinese economy is only 38.6% of US and EU economic output. It is important to note that carbon output in the US and Europe has been steady and even declining as their economies are expanding. Another startling fact is the Chinese economy represents 16.3% of Global GDP (also World Bank data) and yet contributes nearly 29% of the 34.2 billion tons of carbon emissions, according to the British Petroleum Statistical Review. In our view, China has a great deal to do to meet its 2060 carbon neutrality pledge on its way to becoming the world’s largest economy, starting with action on its COP21 Paris commitments including reducing its dependence on coal.  [chart courtesy British Petroleum Statistical Review, © 2021]

WCM Chart of the Week for November 30, 2020

Beyond the rosy headlines of a strong economic recovery and a rally of over 40% in the Shanghai Shenzhen CSI 300 Index from the depths of the pandemic, trouble may be brewing in China’s bond markets. Total debt in China was approaching 325% of GDP in 2019, a point that economies generally struggle. The largest segment of total debt growth from 2018 to 2019 was in the corporate sector, which rose from 165% to 205% of GDP. China’s 2019 corporate debt binge appears to have hit a wall. According to Chinese media reports as much as 69% of private enterprises have defaulted on their outstanding loans so far in 2020 and the festering crisis may impact local governments and state enterprises as well. Further deterioration in the Chinese financial system would obviously have negative implications for the rest of the world.

WCM Chart of the Week for August 28, 2020

The US stock market continues to rebound from the pandemic panic-driven lows, with the NASDAQ and S&P 500 continuing to post new all-time highs over the past several weeks. This is prompting investors to question if the current rally can last, or even if it marks the beginning of a new bull market.  There are risks that could derail the stock market’s advance ranging from tensions with China, resurging virus hot spots, social upheaval around the country, and the upcoming national elections. The US labor market is also a persistent drag and will not likely have recovered until well into 2021.

There are several factors that are supportive of asset prices including unprecedented fiscal and monetary support, and mounting positive momentum in key economic sectors such as manufacturing, housing and the consumer.  As previously mentioned in our COTWs, in the US personal savings rates remain elevated and personal balance sheets have been de-levered, suggesting the consumer has the ability to spend if they wish.  This week’s chart highlights total assets in money market funds, which remain near peak levels suggesting private investors have been underexposed to equities during the stock market’s historic recovery rally.  This is a condition many cite as additional evidence that equities could continue to advance higher in the months ahead. [chart courtesy Bloomberg LP © 2020]

WCM Chart of the Week for June 19, 2020

Chinese Communist Party (CCP) aggression in the Asia-Pacific region is on the rise. Military tension along the Himalayan border with India resulted in some 20 Indian soldiers perishing this past week. Chinese naval ships have been harassing the Japanese commercial fleet in the East China Sea, and exhibiting similar in Vietnamese, Malaysian, and Indonesian trade routes in the South China Sea. Domestically, the CCP is suppressing Hong Kong freedoms in violation of the 1984 Sino-British Joint Declaration. Globally, the lack of COVID-19 related contrition or even transparency regarding the origin and spread may all contribute to China-related backlash or retaliation. Nearly all Pacific nations have aligned with the US against Chinese aggression. We find it odd that the CCP has chosen hostility in their weakened economic condition, a moment when they really need the rest of the world for their own recovery efforts. Unfortunately, this situation is unlikely to de-escalate anytime soon.  As an example, China’s defense spending is approaching four times India’s and that military show of strength compromises the Asia-Pacific region’s stability and sovereign rights. [source: World Bank and Bloomberg LP © 2020]

« Older posts