Author: WCM (Page 6 of 9)

WCM Chart of the Week for August 15, 2018

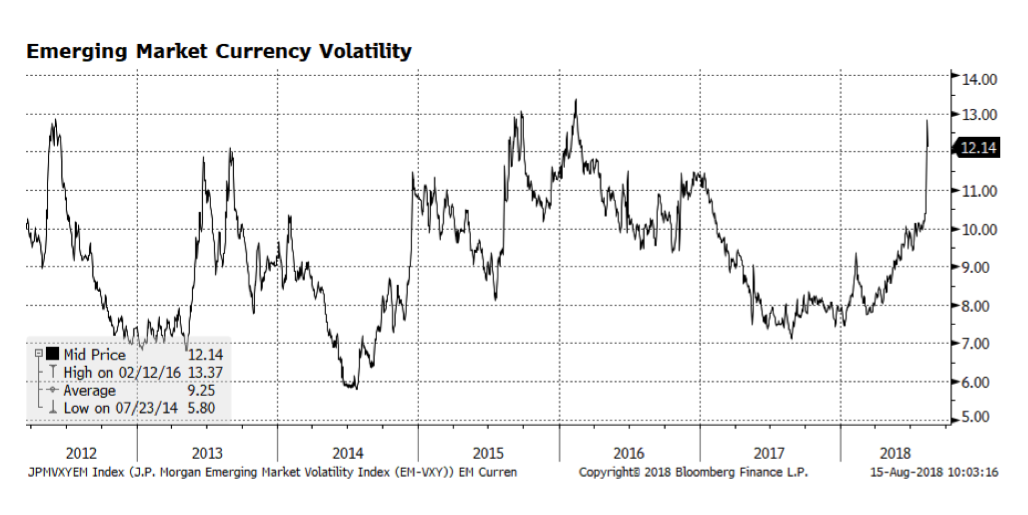
Volatility in the world’s emerging economies has spiked, in our view related to Turkey’s building economic and currency crisis. We continue to avoid direct exposure to Turkish equities and emerging market debt overall but are concerned that the crisis could spread to other countries in the region. One concern of ours is the European banking sector which is already struggling with Italian debt exposure. So far this week some stability has returned to the Turkish Lira as the government announced relaxed standards for troubled loan restructuring. But, ultimately interest rates will likely have to be raised to support the currency.

WCM Chart of the Week for August 8, 2018

JPMorgan’s CEO Jamie Dimon, arguably the world’s most influential banker in decades, is known for making headlines.  This week he commented that investors need to get ready for interest rates on the benchmark US 10-year treasury approaching 5%.  Many reacted with skepticism given current yields hovering around 3%, but robust economic conditions in America should push interest rates to more normal levels.  Prior to the crisis, yields on benchmark government bonds in the US and Europe were hovering near Dimon’s stated range, consistent with long-term nominal economic trends.  We do not take issue with his comments; we only suggest that they be considered in a global context. Interest rate differentials in the western world that were fairly tight prior to the crisis have diverged over the course of the past five years or so.  We have believed for some time now that rates in the US will be tethered lower due to anemic economic conditions in the rest of the developed world.  Is this a longer-term or near-permanent investment condition with respect to the Eurozone?  Japan has had to deal with low yields, sluggish economic growth and persistent deflationary pressures for years.  Europe is more diverse and arguably more dynamic than Japan but… #moreofthesame #Fed #lowrates #yield #lostdecades

WCM Chart of the Week for August 1, 2018

Over the past week or so turbulence has returned to US equity markets as several leading social media companies have announced disappointing results. However, according to Bloomberg, approximately 85% of S&P index members have exceeded expectations this earnings season, yet the market reaction has been muted. Investors may be concerned about the length of the current bull market and its ability to climb higher despite positive US corporate results. This is understandable given how far the S&P 500 has risen since the financial crisis.

However, we would point out that the S&P 500 measured on a total return basis including gross dividends (pictured below in log scale) had a longer and steeper ascent from the late 1980s until the technology bubble burst in 2000. The market during the tail end of that period was also driven by the technology sector but valuations were bloated then as earnings in many cases were weak or non-existent. From a market psychology perspective, last week brought good news — on July 26 the S&P 500 total return index closed at an all-time high of 5,607.99. We are mindful of current valuation metrics and believe the overall market can advance further if earnings continue to be robust.

WCM Chart of the Week for July 25, 2018

Consumer Discretionary stocks have outperformed the S&P 500 for nearly a year and appear to be peaking. Valuations of the sector are stretched as compared to historical averages and the overall market. That has a lot to do with two of the sector’s largest constituents, Amazon and Netflix, both of which have been expensive for several years but are key players in the increasingly technology-driven new economy. We have an active allocation to the sector and we pay close attention to how it and its key names are faring fundamentally and performance-wise. The case can be made for further outperformance as the overall economy and the consumer strengthens.

WCM Chart of the Week for July 18, 2018

US equity markets have been driven by the technology sector over the past several years as investors allocated to this key area of the US and increasingly global economy. For some time, technology stocks have delivered superior growth characteristics that normally could be sought in US Small Cap equities or the world’s emerging markets. Current valuation readings in technology are stretched as compared to the overall market and their own longer-term averages. The key going forward is whether the dominant technology companies, often referred to as the FAANG* stocks, can continue to deliver strong earnings this season as well as in coming quarters. A concern to many – including us – is that the rally in large cap stocks has become increasingly narrow and dependent on these companies. However, market leadership appears to be rotating into US Small Caps which could drive equities going forward.
*Facebook (FB), Apple (APPL), Amazon (AMZN), NetFlix (NFLX) and Alphabet – widely known as Google (GOOG/GOOGL)

WCM Chart of the Week for July 11, 2018

The US Personal Consumption Expenditure Price Index is one of the Fed’s preferred measures of inflation. In the years since the financial crisis the Fed’s has been challenged bringing inflation near its’ 2% target. The recently released May reading came in at an annual rate of 2.3% which was slightly higher than consensus expectations and is the highest reading since April 2012. The eternal challenge for the Fed is maintaining acceptable levels of inflation yet this cycle they are committed to gradually raising policy rates while simultaneously winding down its’ bloated balance sheet. An added complexity is the lack of inflationary pressures elsewhere in the world which in turn, may allow the Fed to tolerate higher than target levels of inflation domestically.

WCM Chart of the Week for June 27, 2018

We have been intrigued over the past several months by total return trends in US bond markets. It has been a rough first half of the year for bonds so far with the Bloomberg Barclays US Aggregate Total Return index contracting 1.95% year-to-date through June 22, 2018. What is interesting to us is prices have fallen to a greater degree in US investment grade corporate bonds as measured by the iBoxx Very Liquid index, (-4.78%) as compared to with the Bloomberg Barclays US Treasury Index (-1.43%). This has occurred while US corporate fundamentals are quite strong.

What concerns us is that interest rate spreads (depicted in the chart) between US investment grade corporate credit and US Treasuries have climbed from levels we last experienced during the pre-crisis era. This could just be a pause and spreads resume their tightening path that began several years ago, ultimately approaching lows reached in 2007. Or we could see further widening that could signal economic and market deterioration. There are many dynamics at play – central bank activity across the globe is a major factor – and this is one simple measure, yet we believe it is a critical one.

WCM Chart of the Week for June 19, 2018

US Treasury Spreads Continue to Narrow

Interest rate spreads in the US Treasury market are continuing — a major concern for investors over the past several quarters. This week’s chart shows the difference between 10-year and 2-year US Treasury yields with the shaded areas marking recessionary periods. As these two yields converge, or when the yield on the 2-year surpasses the 10-year yield, recessions often follow. The current spread is 37 basis points, but it is heading towards parity rapidly. It is difficult to forecast an imminent recession because of the positive trends in employment, consumer and business spending, benign inflation and expansionary fiscal activity. Yet this indicator has strong predictive power and should not be ignored. One major difference in this cycle versus previous ones is the amount of central bank activity throughout the world and as a result treasury spreads might not have the same predictive force as before.

WCM Chart of the Week for June 12, 2018

Ooooh. Color! This week’s focus is on major central bank activity with the European Central Bank (ECB), the US Federal Reserve and the Bank of Japan (BoJ) all scheduled to make policy announcements at the conclusion of their respective meetings. Beginning Wednesday with the US Fed, market observers are widely expecting a further 0.25% increase in the Federal funds rate but the focus will be on which words are selected and projections going forward. The ECB follows on Thursday and the key to their statement will be any adjustments they intend to make regarding the bond buying program and the impact on the balance sheet, pictured below. The BoJ closes out the week on Friday and market participants are largely expecting no change to current policy given inflation is below target and the tightening labor market does not appear to be adversely impacting prices.

WCM Chart of the Week for June 6, 2018

We’re back to charts after a holiday week hiatus, but Italy didn’t take a break. Another Euro-related crisis may be lurking in Italy as the populist coalition government, consisting of the Five Star Movement and the far-right League parties, have formed an administration. Although the parties have dropped some of their most alarming campaign rhetoric concerning exiting the Euro and EU, investors have re-focused on Italy’s sovereign debt levels now surpassing 130% of GDP (well beyond EU budget rules) and the limitations it imposes on fiscal flexibility.

Not surprisingly, the Euro has weakened considerably — particularly against the US Dollar. The cause of the softening Euro likely spans beyond Italy’s contribution of 15% EU GDP. Several key Eurozone economic indicators such as industrial production, business sentiment and consumer confidence appear to be losing momentum.

« Older posts Newer posts »