The yield on the US Treasury bond, currently 3.06%, has pushed through the 3% level for the fourth time since the beginning of the year. We view this as a positive development and further confirmation that economic trends in the US continue to improve. The state of the US economy and corporate America is arguably more robust than at any point in the post crisis era. Our concern is whether risk assets can sustain materially higher interest rates and, so far, US stocks have proven resilient while the rest of the world has struggled, particularly the emerging markets. 
Page 20 of 28
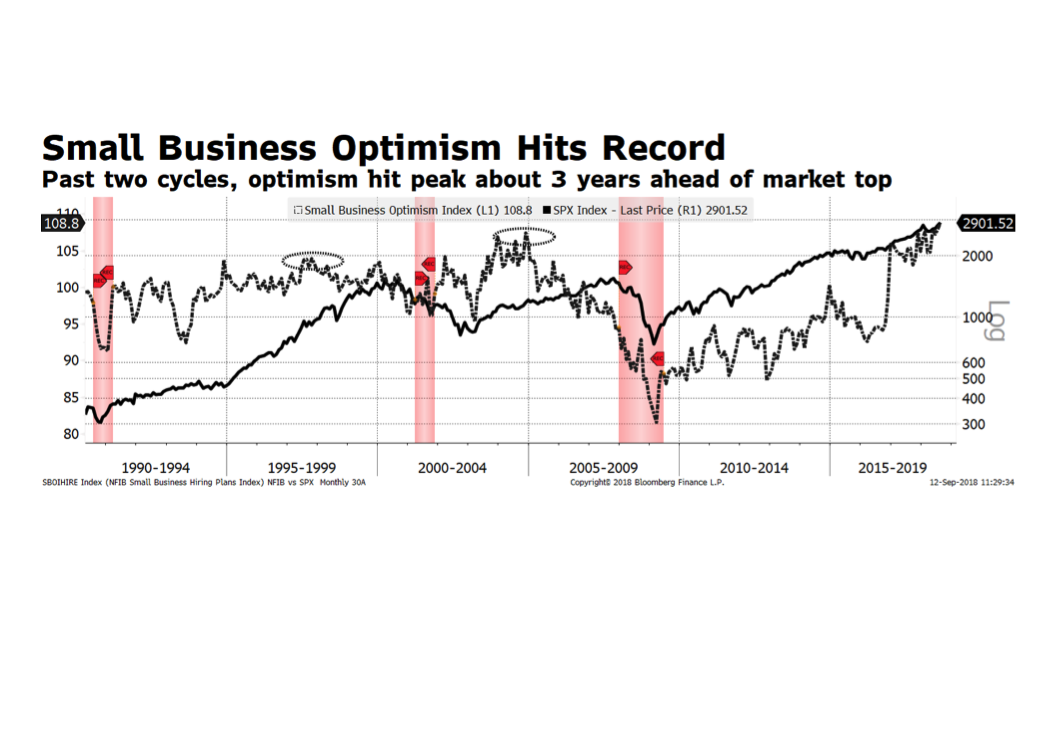
Our chart of the week comes courtesy of Bloomberg. The National Federation of Independent Business released its US Small Business survey this morning and the sentiment index reached 108.8, the highest reading in its 45 year history, even surpassing the previous peak reached in September, 1983. Other highlights in the report include: 1) capital spending plans are the highest since 2007; 2) inventory investment is the strongest since 2005; and 3) a record 26% of business owners plan to expand hiring. As the chart below shows, strong sentiment has been supportive of further gains in US stocks and in some cases for several years. But then, as sentiment wanes, equity prices weaken.
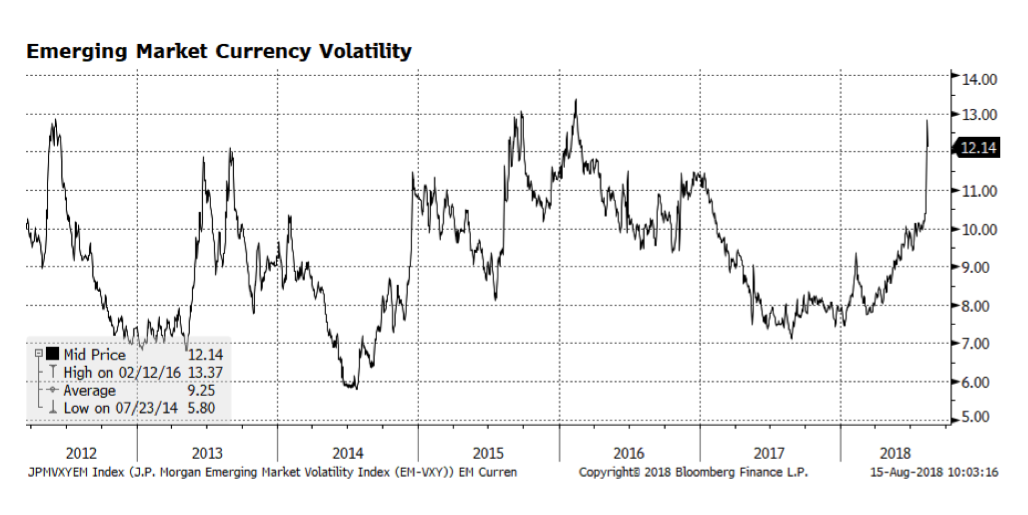
The JP Morgan Emerging Market Currency Volatility Index remains elevated as concerns about currency stability appear to be spreading among several of the world’s developing nations. The currency rout that began in Argentina, moved on to Turkey due to the country’s double-digit inflation and sizeable current account deficit, has spread to Indonesia and now South Africa. Investors fear that the contagion will spread further throughout the developing world. The fundamental economic backdrop is not uniform across emerging markets – Asia is generally exhibiting admirable growth trends – yet in the near term, negative momentum may overtake fundamentals. 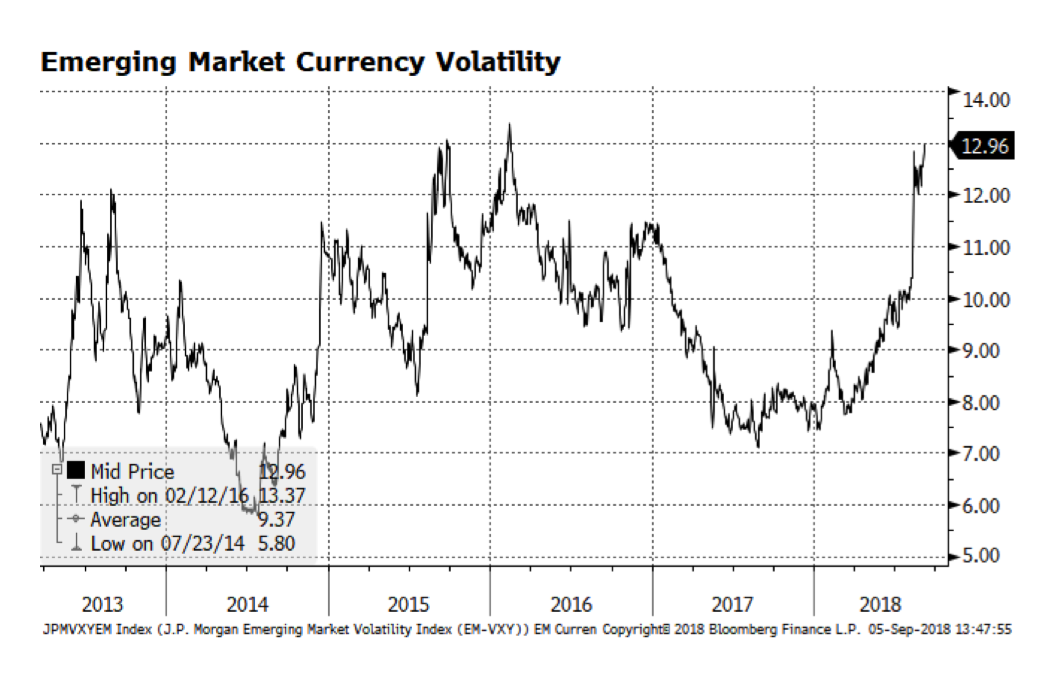
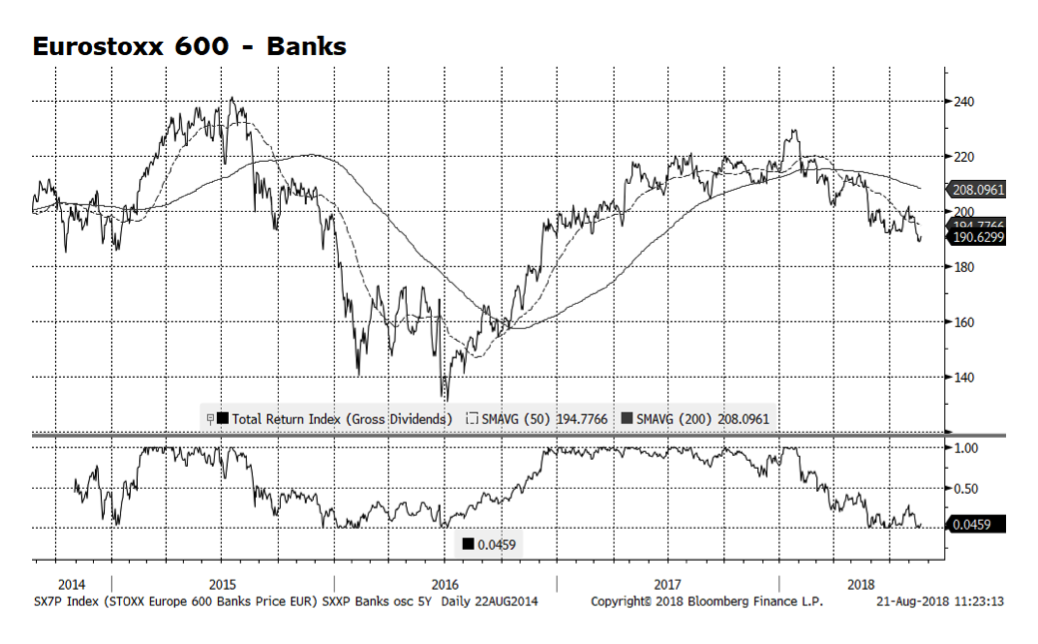
We recently reduced our position in Eurozone equities, which brings our overall exposure to Europe further underweight. One area within European equities that we are quite concerned about is the bank sector. The Italian debt situation is at the heart of the matter as interest rate spreads between Italian and German bonds have been widening. The rising risk premium demanded by investors is one indication of concern regarding the scale of the new Italian governing coalition’s fiscal plans. The deteriorating value of Italian debt impairs bank balance sheets across the region and in turn pushes European bank share prices lower (depicted on the chart below). The interdependence of European banks and government debt has been problematic for some time and measures are being taken by regulators to address this relationship.
Volatility in the world’s emerging economies has spiked, in our view related to Turkey’s building economic and currency crisis. We continue to avoid direct exposure to Turkish equities and emerging market debt overall but are concerned that the crisis could spread to other countries in the region. One concern of ours is the European banking sector which is already struggling with Italian debt exposure. So far this week some stability has returned to the Turkish Lira as the government announced relaxed standards for troubled loan restructuring. But, ultimately interest rates will likely have to be raised to support the currency.
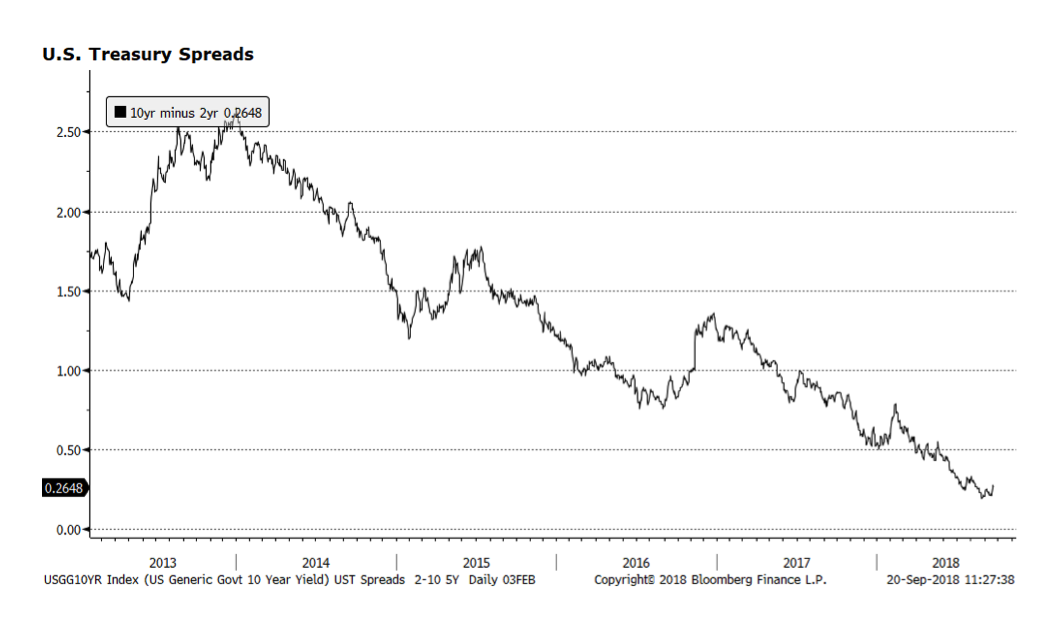
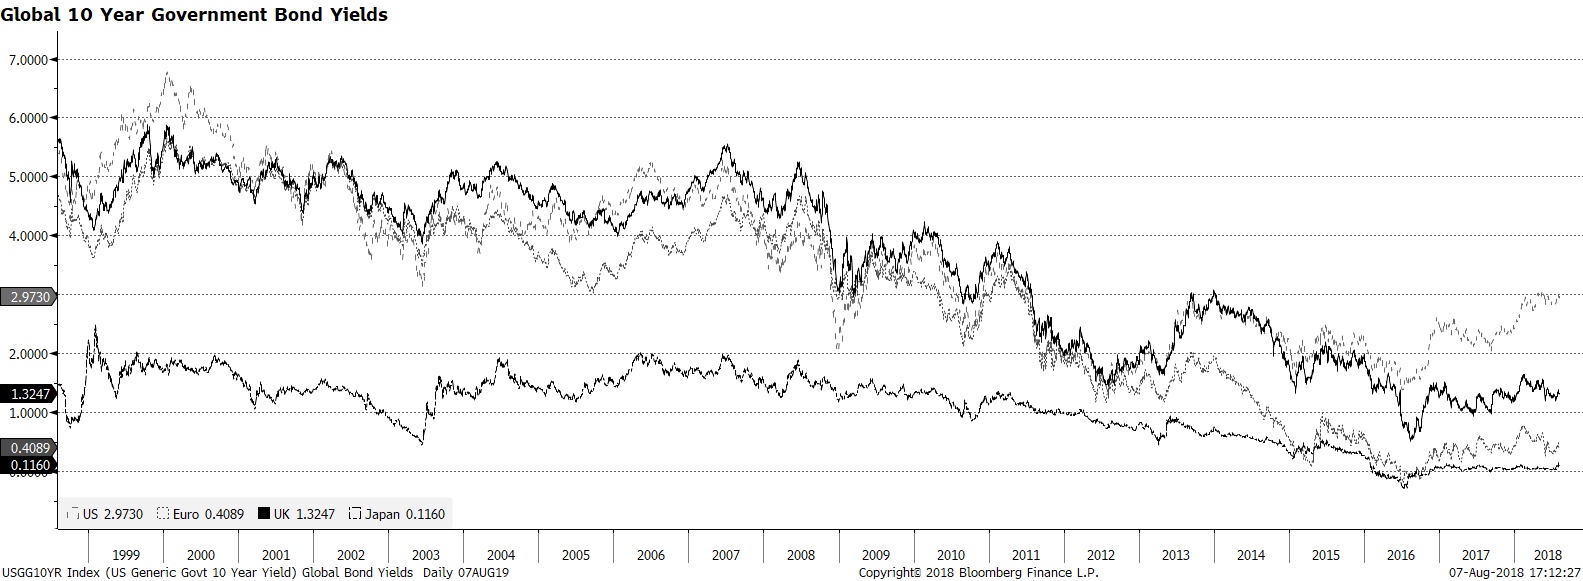
JPMorgan’s CEO Jamie Dimon, arguably the world’s most influential banker in decades, is known for making headlines. This week he commented that investors need to get ready for interest rates on the benchmark US 10-year treasury approaching 5%. Many reacted with skepticism given current yields hovering around 3%, but robust economic conditions in America should push interest rates to more normal levels. Prior to the crisis, yields on benchmark government bonds in the US and Europe were hovering near Dimon’s stated range, consistent with long-term nominal economic trends. We do not take issue with his comments; we only suggest that they be considered in a global context. Interest rate differentials in the western world that were fairly tight prior to the crisis have diverged over the course of the past five years or so. We have believed for some time now that rates in the US will be tethered lower due to anemic economic conditions in the rest of the developed world. Is this a longer-term or near-permanent investment condition with respect to the Eurozone? Japan has had to deal with low yields, sluggish economic growth and persistent deflationary pressures for years. Europe is more diverse and arguably more dynamic than Japan but… #moreofthesame #Fed #lowrates #yield #lostdecades
Over the past week or so turbulence has returned to US equity markets as several leading social media companies have announced disappointing results. However, according to Bloomberg, approximately 85% of S&P index members have exceeded expectations this earnings season, yet the market reaction has been muted. Investors may be concerned about the length of the current bull market and its ability to climb higher despite positive US corporate results. This is understandable given how far the S&P 500 has risen since the financial crisis.
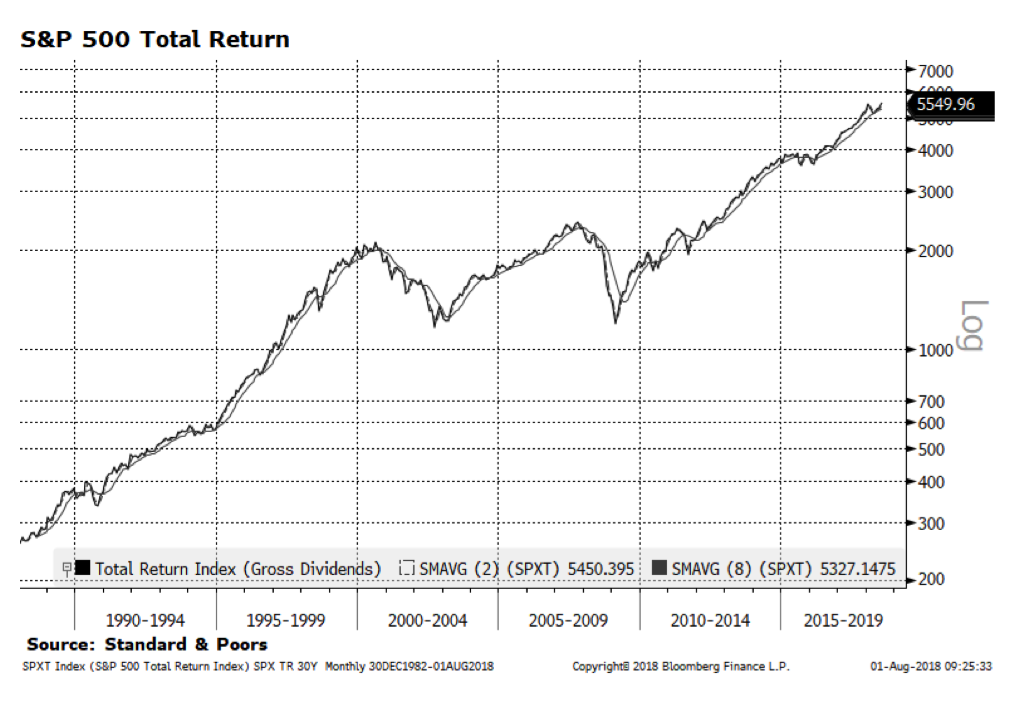
However, we would point out that the S&P 500 measured on a total return basis including gross dividends (pictured below in log scale) had a longer and steeper ascent from the late 1980s until the technology bubble burst in 2000. The market during the tail end of that period was also driven by the technology sector but valuations were bloated then as earnings in many cases were weak or non-existent. From a market psychology perspective, last week brought good news — on July 26 the S&P 500 total return index closed at an all-time high of 5,607.99. We are mindful of current valuation metrics and believe the overall market can advance further if earnings continue to be robust.
Consumer Discretionary stocks have outperformed the S&P 500 for nearly a year and appear to be peaking. Valuations of the sector are stretched as compared to historical averages and the overall market. That has a lot to do with two of the sector’s largest constituents, Amazon and Netflix, both of which have been expensive for several years but are key players in the increasingly technology-driven new economy. We have an active allocation to the sector and we pay close attention to how it and its key names are faring fundamentally and performance-wise. The case can be made for further outperformance as the overall economy and the consumer strengthens.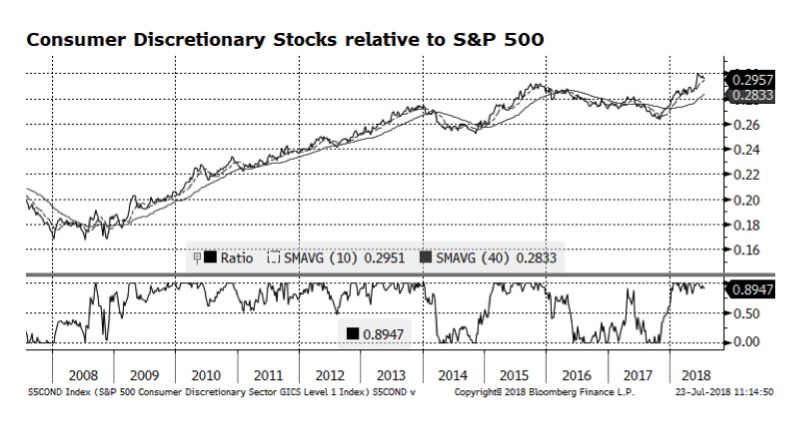
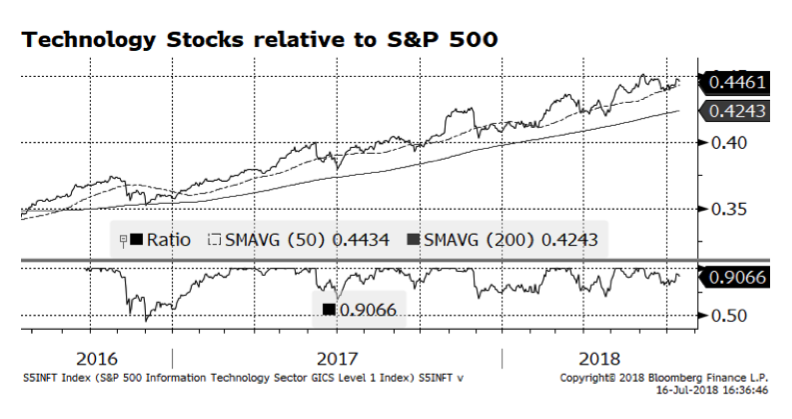
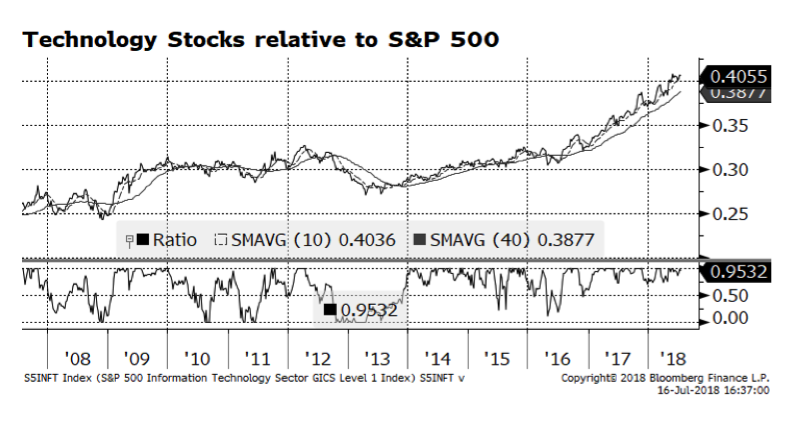
US equity markets have been driven by the technology sector over the past several years as investors allocated to this key area of the US and increasingly global economy. For some time, technology stocks have delivered superior growth characteristics that normally could be sought in US Small Cap equities or the world’s emerging markets. Current valuation readings in technology are stretched as compared to the overall market and their own longer-term averages. The key going forward is whether the dominant technology companies, often referred to as the FAANG* stocks, can continue to deliver strong earnings this season as well as in coming quarters. A concern to many – including us – is that the rally in large cap stocks has become increasingly narrow and dependent on these companies. However, market leadership appears to be rotating into US Small Caps which could drive equities going forward.
*Facebook (FB), Apple (APPL), Amazon (AMZN), NetFlix (NFLX) and Alphabet – widely known as Google (GOOG/GOOGL)
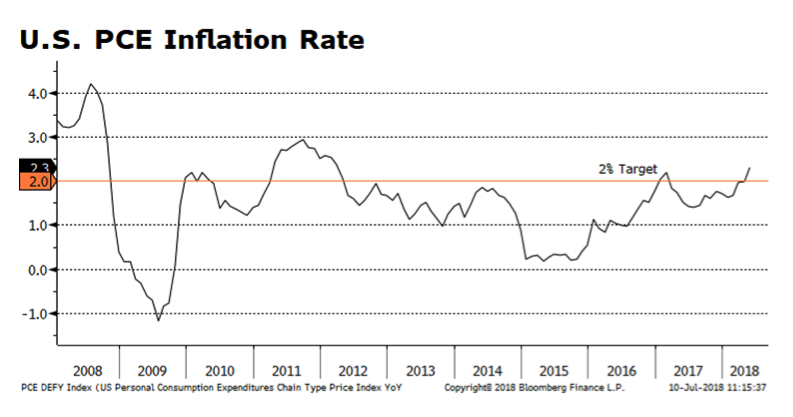
The US Personal Consumption Expenditure Price Index is one of the Fed’s preferred measures of inflation. In the years since the financial crisis the Fed’s has been challenged bringing inflation near its’ 2% target. The recently released May reading came in at an annual rate of 2.3% which was slightly higher than consensus expectations and is the highest reading since April 2012. The eternal challenge for the Fed is maintaining acceptable levels of inflation yet this cycle they are committed to gradually raising policy rates while simultaneously winding down its’ bloated balance sheet. An added complexity is the lack of inflationary pressures elsewhere in the world which in turn, may allow the Fed to tolerate higher than target levels of inflation domestically.

