Category: General (Page 11 of 17)

WCM Chart of the Week for April 3, 2018

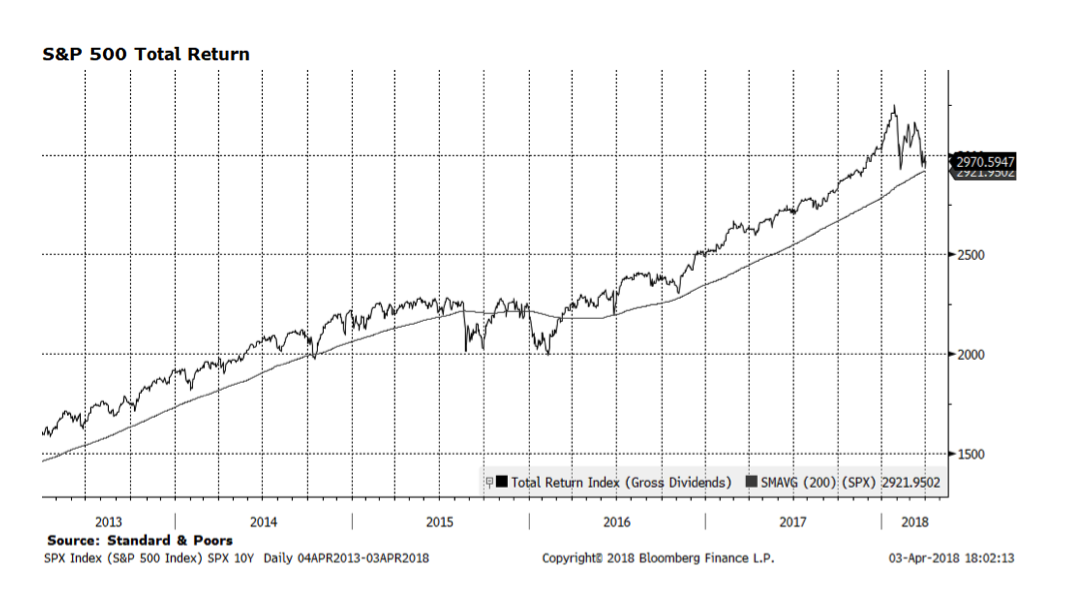
There has been an increased level of volatility in US equities across several key larger capitalization indexes going back to the first week of February. Lately, investors have been attempting to identify what may lead to a market bottom and many have been drawing attention to S&P 500 price levels relative to its 200-day moving average — a key long-term trend measure. On April 2nd the S&P 500 price index closed below the 200-day moving average for the first time since late June 2016. Today, the index recovered and closed slightly above that trend line. The question for investors is whether the correction will deepen or did yesterday mark the resumption of the bull market.

On a total return basis (which we find more relevant as that is what people actually get by investing), the S&P 500 has yet to close below the 200-day moving average. That is critical in our view, although we do acknowledge that this measure is precariously close to turning negative. What appears to be escalating trade friction between the US and China among other trading partners, potentially developing into a much broader trade war, is the most likely reason US equities have entered a corrective phase. The market is now trading at valuations last seen in 2016 which could be a bargain since fundamentals in the US remain strong and earnings are expected to be robust in coming quarters.

Stormy Weather

Made you look. No, this is not about that. This is also not about tariffs and trade wars. This is a reminder that there are more forces at work in the market, more fundamental forces, than just headline news.

The Technology and Consumer spaces have been having a bit of a Waterloo moment. A steady drumbeat of information breaches from tech firms, consumer credit firms, major merchants, health insurers and others has shown that our digital lives are the new currency of commerce, and thieves will gladly take and then sell this information to the highest bidder.

To date, the response has been largely profiteering. Play on the concerns of the citizenry that companies cannot be trusted to care for their personal identifiable information and sell them identity protection and credit protection services, in some cases crassly by the very same companies that fumbled the information into the open in the first place.

Continue reading

WCM Chart of the Week for March 22, 2018

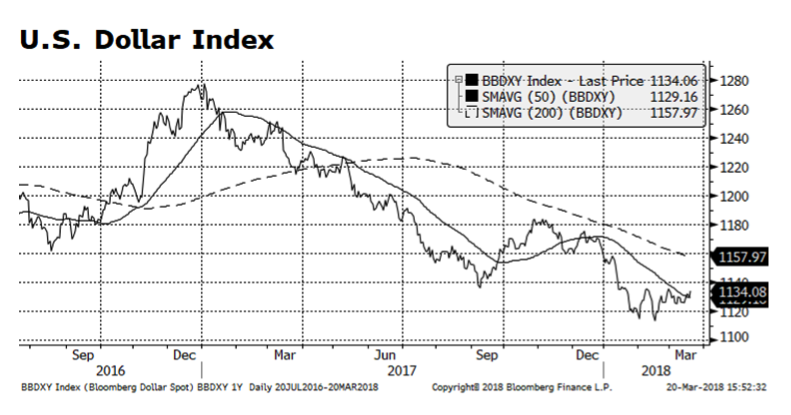
Larry Kudlow was appointed by President Trump as Director of the National Economic Council, replacing the widely respected Gary Cohn. Kudlow, a former Federal Reserve and Wall Street economist and most recently a television host on financial news network CNBC, has raised some eyebrows with his comments regarding his support for a strong dollar. The dollar has been in a downward trend against a basket of major currencies since the beginning of 2017, although it has strengthened modestly over the past month or so. Weakness may have been more related to economic repair or the regaining of lost ground for the rest of the world versus the US. We view that as positive for the global economy and not necessarily a bad thing for the US. Corporate US fundamentals – most notably earnings growth – are robust and should support securities prices going forward. But, a stronger dollar could place downward pressure on earnings and serve as a headwind.

WCM Chart of the Week for March 13, 2018

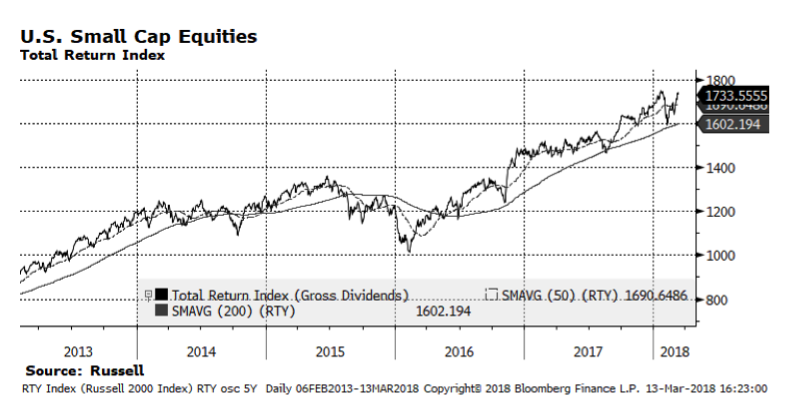
Every cycle is a bit unique, but usually small- and mid-size companies underperform in the late stages of market cycles and ultimately contract more than their large-cap counterparts as markets correct. There is much concern that this cycle is in an advanced state and a consolidation or correction phase is upon us. What we find interesting is that small cap US stocks are rebounding and approaching all-time highs. We view this as an important development if the trend continues, especially with the heightened volatility of late. We also note that it appears that small- and mid-cap stocks have contracted less over the past week or so than large-caps on days when the major indices are negative. If these key segments of the stock market can surpass levels reached earlier in the year, that would mark obvious positive milestones and could lead the overall market higher still. Fundamentals dominate our analysis, but these technical factors are worthy of our attention as well.

Tariffic

Here is something  on which the Partners at WCM do not agree. We have a diversity of views as to the merits of punitive tariffs and the possibility of a trade conflict if not a full-on trade war. There is an extraordinary amount of complexity in the system, and as a consequence no clear, straight line of causality. Raising steel and aluminum tariffs could help to revitalize US industry and jobs, or it could raise input costs for infrastructure companies, auto and plane manufacturers, commercial builders, etc. Those tariffs could spark domestic activity, or it could kill jobs and mute the stimulative effects of the recently legislated tax cuts. Our disagreement is fine. That reflects the realities of the country and the economy, and therefore the markets in which we operate. Economists, analysts, academics, business leaders, pundits, policymakers, politicians, and the press all have hot takes on what this does and could mean, but nobody knows, including us.

Continue reading

WCM Chart of the Week for March 5, 2018

Equities in the Eurozone have had difficulty keeping pace with their global peers. There have been many encouraging signs on the economic front within the common currency zone, stock market valuation measures remain attractive compared to peers, and the interest rate outlook remains stable, yet regional shares continue to lag. One reason may be that consensus earnings expectations were inflated and are now being adjusted lower. (Chart courtesy of and copyright Bloomberg Finance LP 2018)

Remember to follow us on LinkedIn, Facebook and Instagram to get our Chart of the Week and other timely content delivered directly to your smartphone.

Beppe vs. Bunga-Bunga

We have been looking at the charts, very much the heart of our process, and are a bit puzzled by Europe. Many of the fundamentals that we have discussed in our blogs, monthly and portfolio updates have been pointing to favorable market conditions for equities and a lid on rates thanks to ECB policy. But the charts – oh the charts. If we take currency out of the equation the market’s performance has been, to be kind, lackluster. Our question – what is holding it back?

Continue reading

WCM Chart of the Week for February 28, 2018

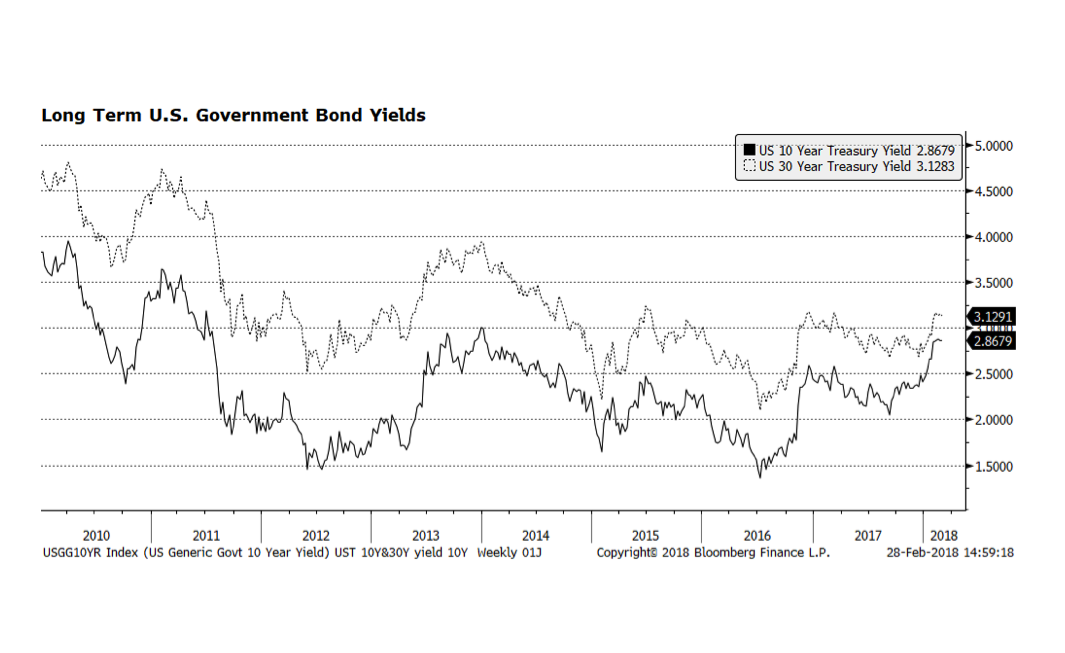
Stock markets around the world have been gyrating in response to higher interest rates – particularly in the United States. Long-term US Government bond yields have increased significantly over the course of the past year and a half. Yields on the 10 and 30 year US Treasuries have recently reached levels that some market participants believe may become headwinds for equities. While recent advances have been steep, interest rates are still well below what would be considered “normal levels” which would imply more volatility in corporate securities markets across the globe.

Chart of the Week for February 20, 2018

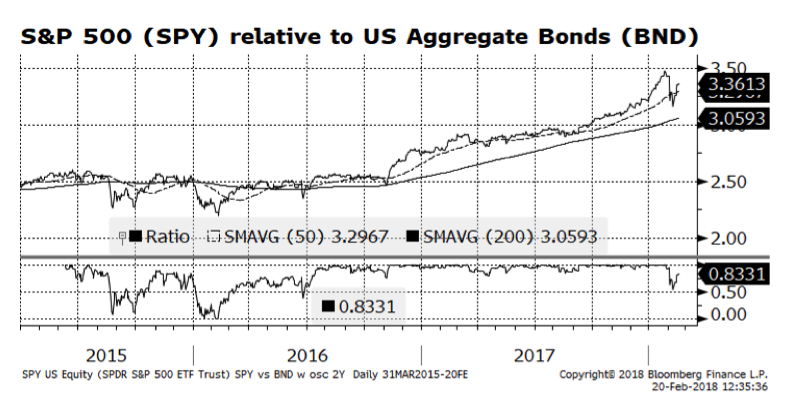
US stocks have regained their footing relative to US fixed income and have resumed their capital market leadership. Stock prices in the US have rebounded from their February 8th low while upward trending interest rates have been an obvious headwind for bonds. The higher interest rate environment, while widely anticipated by some for several years, may be a formidable challenge for equities both here and abroad. In our view, as long as interest rates rise at a moderate pace, equities should continue to advance and the global economic expansion should remain intact.

We would point out, however, that we are in the early stages of the recovery and the market may yet shake investors’ confidence in coming sessions.

Don’t forget to follow us on Instagram, Facebook and LinkedIn to get the COTW in your social media feed.


In or Out?

We decided to sit this one out. The way the market just whipped around over the last few weeks with little provocation, our concern was about informationless volatility, and we did not want to jump into the fray with comments much less action without any additional insight. In our view, there was very little if any new information that came into the market to trigger the bout of vol. A lot of observers and pundits were pointing to data about jobs (or was it wage growth, or perhaps it was GDP?) that signaled the potential for inflation, and with it the specter of a Fed getting the knives out to cut back the easy money. But, at least from our perch, these new data points were not only knowable, they were known, and they were not new. Perhaps rate watchers and equity market participants were hoping if they clenched their eyes very tightly the hallmarks of an expanding economy might go away on their own.

In terms of purchasing power, there has not been real wage growth for at least a couple decades for the cherished middle class, much less their undercompensated neighbors further down the economic ladder. Even at sub-5% unemployment, the quality of jobs may be poor in terms of wages and ability to exploit workers’ educations, skills and capabilities, and many of those workers would take more hours if only they were available. Compounding that, a significant and growing portion of the workforce is self-employed, and not by choice. Many jobs that used to be salaried and permanent, including knowledge economy jobs that were supposed to be the future of employment, have become temporary 1099 gigs if they have not been shipped overseas entirely. When looking at the fundamental reality on the ground, we could not find a rational explanation for why markets choked on encouraging but fairly benign data. An overheating economy appears still far off in the future and the Fed’s path to higher rates is inexorable, yes, but also slow and deliberate.

So what happened?

Continue reading

« Older posts Newer posts »