Category: European Central Bank

WCM Chart of the Week for August 9, 2021

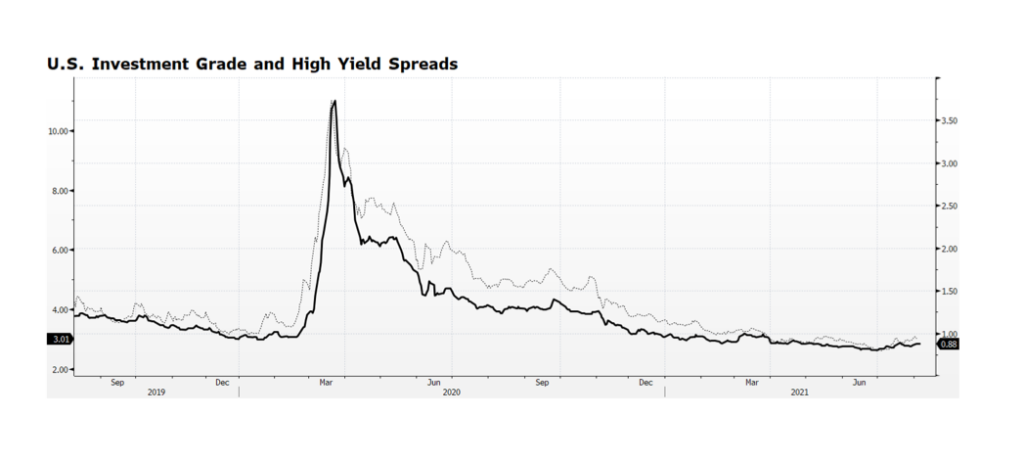
Investment Grade and High Yield bond spreads have been edging higher since reaching their tightest levels ever at the end of last quarter. Admittedly, the spread widening may have more to do with the decline in Treasury yields since June 30th than an indication of any deterioration in the credit markets. What is interesting to us is that this has been occurring while broad stock market indices in the US and Europe are hitting all-time highs. Equity market valuations are full, particularly in the US, but according to Bloomberg consensus earnings are expected to grow by 11.8% over the next 12 months, putting the forward PE ratio of the S&P 500 at 20.3x, lofty yet not extreme. Our sense is that, barring a major surprise or a misstep by the US Fed, the positive tone in equities in the Western world will continue. The outcome of the Fed’s September meeting will be highly scrutinized but the likelihood that they will surprise markets is low. [chart courtesy Bloomberg LP © 2021]

WCM Chart of the Week for May 25, 2021

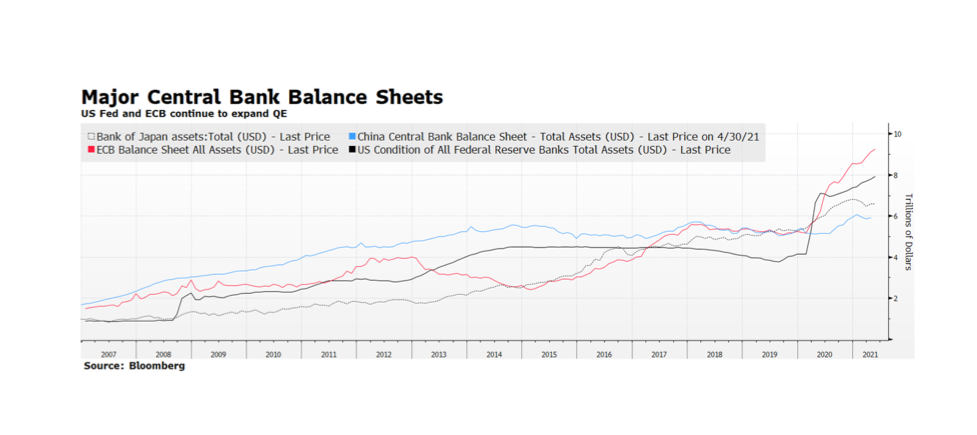
The US Fed and European Central Bank (ECB) continue to pursue aggressive quantitative easing while the two dominant Asian central banks, the Bank of Japan and the People’s Bank of China, have slowed their securities purchases so far this year. The ECB’s activity is of particular interest, not only because of the size of the balance sheet ($9.2T, €7.6T), but the pace that it has expanded over the course of the past year. The ECB’s monetary support continues at a critical time as the EU economy appears to be emerging from the pandemic-induced slump. Lock downs are slowly being lifted and infection rates are plunging from the March and April spikes. Another promising (gradual) trend emerging is in sovereign interest rates in the region, which appears to be an indication of stronger economic activity in the months ahead. [chart courtesy Bloomberg LP (c) 2021]

WCM Chart of the Week for April 12, 2021

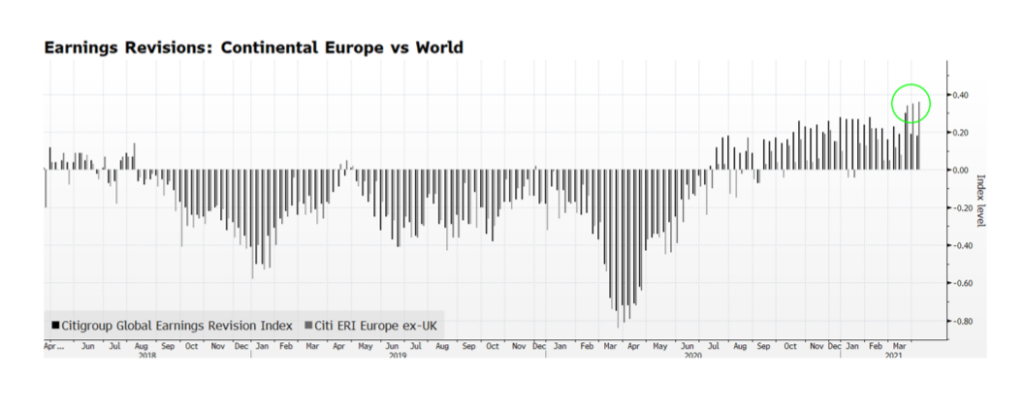
According to Citigroup’s Earnings Revision Indices, Eurozone earnings are far outpacing the rest of the world, and equity prices are gaining on a relative basis as well. Year-to-date through April 12th, Eurozone shares still trail the S&P 500 total return in US dollar terms 7.2% to 10.2%. Equity investors may be signaling that even in the midst of reimplemented economic shutdowns and virus spikes, the worst may be over on the Continent and more prosperous conditions are on the horizon. There are also reasons to be optimistic about the region’s stocks — they trade at favorable valuations compared to US equities and the ECB is continuing to be highly accommodative making fixed income alternatives unattractive. If Eurozone equities can continue to rally and broaden the global advance of stocks it would likely provide a boost of confidence for investors worldwide. [chart courtesy Bloomberg LP, Citigroup © 2021]

WCM Chart of the Week for March 22, 2021

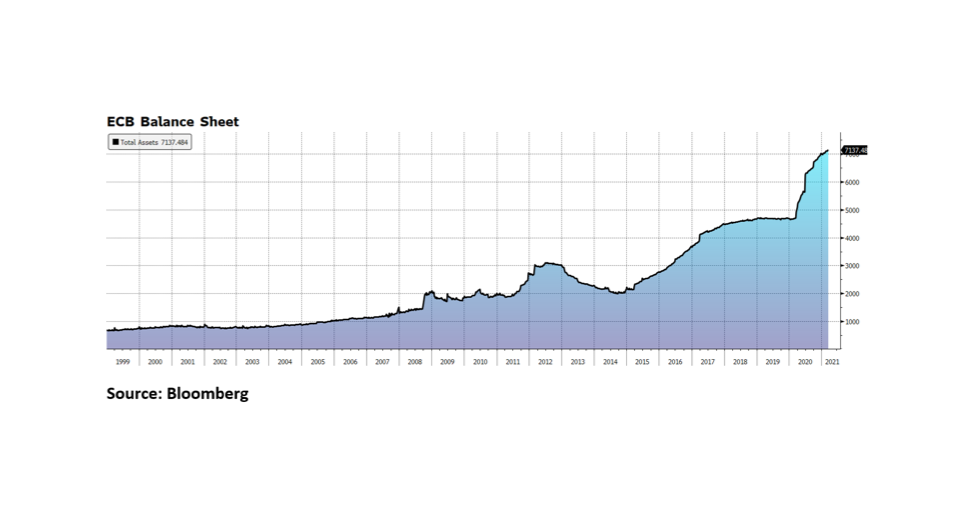
The European Central Bank’s net purchase of bonds through March 19th surpassed 21 billion Euros, the most since December, in an attempt to halt the rise in continental bond yields. According to Bloomberg, the yield on the Generic 10-year Euro Government Bond has risen from -0.67% in mid-December last year to -0.3% currently. Granted, Euro yields from 2-to-10 year issues are still negative but the pace of escalation has many concerned given the economic headwinds caused by the pandemic and the recent resurgence of infections and “re”closings. ECB President Christine Lagarde arguably faces a tougher challenge than her central bank counterparts because the EU does not have the fiscal flexibility of other major economies. That constraint may turn out to be a blessing for them as the US, for instance, implements yet another round of fiscal stimulus amounting to $1.9 trillion while the economy across the pond shows signs of accelerated economic activity.

WCM Chart of the Week for October 26, 2020

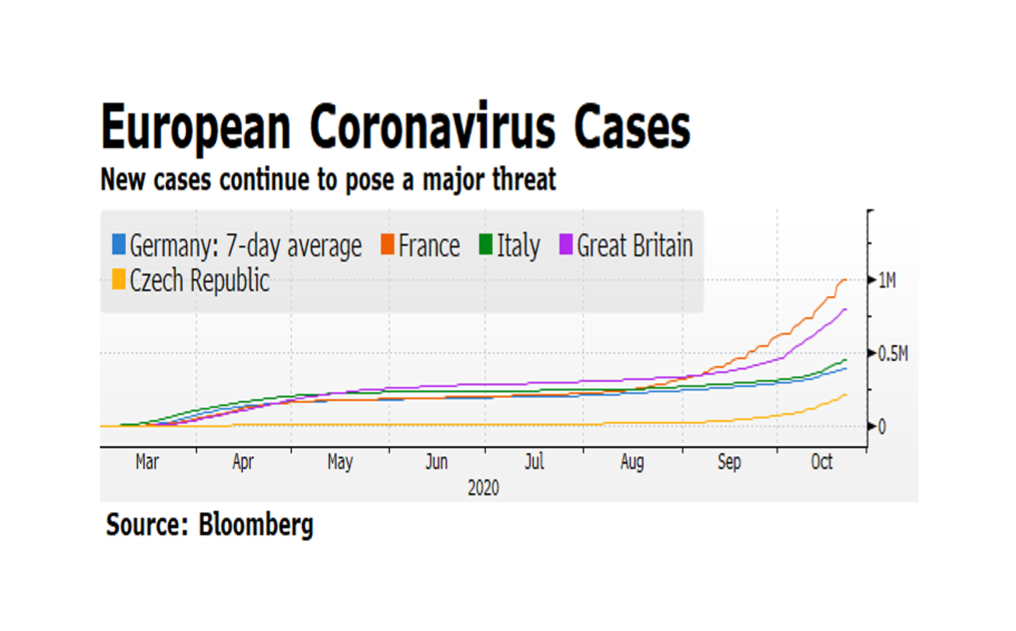
Over the past decade or more, Europe has endured several painful crises spanning Euro-related stresses to the recent Brexit uncertainty.  The common thread retarding recoveries from these epochal events has been the lack of coordinated policy response, in particular fiscal stimulus. The European Union, now with the UK removed, simply does not have the strength to influence its member states to expand fiscal spending that would benefit the region beyond each country’s own national borders. Now the global Coronavirus pandemic is accelerating to frightening levels across Europe as evidenced by case momentum. The imprint on European stock prices is telling.  From the onset of the pandemic, the broad-based EuroStoxx 600 is over 8% lower in US dollar terms and has been range trading since early June. By contrast, The S&P 500 is flirting with all-time highs. We believe the difference is that, while Europe has generally been more aggressive in the public health response to the pandemic, the overwhelming US fiscal and monetary response carries the day as compared to the apparent EU policy vacuum.

WCM Chart of the Week for April 3, 2020

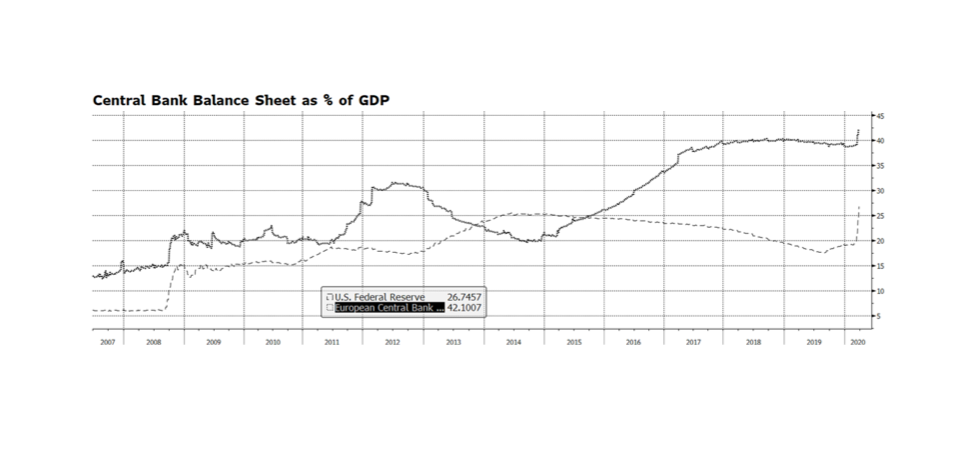
The US Federal Reserve has taken several powerful steps in recent weeks ranging from lowering policy interest rates, intervening in credit markets to provide stability and re-engaging in asset purchases, also known as QE. The amount of monetary stimulus is unprecedented and staggering. Since March 4, the Fed’s balance sheet has expanded nearly $1.6 trillion through their asset purchase plan, accumulating Mortgage Backed Securities, Treasuries and Corporate Credit. That is an incredible amount of expansion in such a short period of time considering that it took some 15 months during the financial crisis from when the QE program began to reach an equivalent level of assets. Some are concerned that the Fed has expended all of its monetary tools and that is a real concern given policy rates are at or near zero. The balance sheet now stands near $5.9 trillion, a level that just a few years ago would have seemed unimaginable. But it could become even larger. The Fed’s balance sheet represents nearly 27% of US GDP. By contrast the European Central Bank’s balance sheet stands at over 42% of European Union GDP. The Bank of Japan stands at over 100% of GDP. The Fed’s asset purchase program could even become more active and remain manageable, especially considering the relative vibrancy of our economy compared to Europe and Japan. [chart courtesy Bloomberg LP © 2020]

The view from here

In these last hours before the US markets open for this week’s sessions, here are a few more thoughts we have shared in our community.

Global markets finally caught up, in the negative sense, to China’s stock markets as worries about the COVID-19 “novel” coronavirus spread to the developed West faster than the disease itself. A contagion of concern overtook markets and left us with a week of returns we have not experienced since the Financial Crisis in 2008. What is materially different from our perspective is that this correction is not a response to a lack of faith in the system itself. During the Crisis, securities prices collapsed on the fear that it was actually impossible to value many of them, and that large parts of the system were in fact worthless. In certain cases this did prove to be the case as a sudden disappearance of liquidity exposed a large quantity of bad loans and mortgages that had been ingested by major financial institutions, causing the collapse of systemically important operations like Lehman Brothers, Bear Stearns, Washington Mutual and Countrywide. There was absolutely widespread panic that we could be facing a new Great Depression as the financial system itself seized.

This past week was very different. As we have previously explained, COVID-19 of course has and will continue to have economic consequences, but it does not call into question the soundness of markets, banks and whole economies as we experienced a dozen years ago. We find it likely that the response to the virus will impact company earnings and the GDP of nations. Shutting down the 2nd largest economy (China) for weeks if not months would never have gone unnoticed and unpriced. Reasonably, that demands revisiting what companies are worth and whether yesterday’s prices reflect tomorrow’s realities. Prior to the outbreak, fundamentals were reasonably solid around the world. Not boom, but certainly not bust. The situation we find ourselves in could take that optimism down to modestly solid, or perhaps slightly weakened. But even a mild global recession triggered by this moment does not call into question the fundamental underpinnings of finance and commerce. We are seeing steep and sudden drops in stock markets that remind us of 2008, and nearly unprecedented lows in interest rates, without anywhere near the breakage that brought about those kinds of corrections historically.

So, in a word, why? We see a few different forces at work which all feed our collective response to unconstrained uncertainty. Emotion, namely fear, is always a powerful motivator. Fear of the virus, fear of losing money, reasonably make people want to be safe. 2008 still looms large in the minds of investors and a PTSD-type response is not out of character. Fool me once, shame on you. Fool me twice, shame on me.

That emotion is being fed by a toxic brew of real, or worse, real but incomplete, data without framing or context, and quite a lot of false narratives. Add to that the markets are now patrolled and exploited by algorithms and artificial intelligence engines that can actually capture and quantify shifting sentiment and strong moves one direction or another in prices, and exploit or even amplify or aggravate those moves for profit. We have seen numerous isolated examples of this played out in the “Flash Crash”, the “Fat Finger”, and other moments over the last many years which show how quickly and to what extremes things can break loose on little information or bad information. Throw something at the market like the novel coronavirus and we could experience those types of extreme (over)reactions again and again.

We anticipate that clarity and greater understanding around the virus’ pandemic qualities and impacts will help markets firm up, and would not be surprised to see a fair price for securities settle at something less than the peaks from just a couple weeks ago after accounting for the drag from lowered economic activity. It is also our expectation that we will see some manner of coordinated global response across the major central banks to compensate not for falling stock prices but for potential lost GDP from less commerce, less travel, and less work. Depending on the magnitude of the response this could put a floor in prices, or at least slow the descent and tamp down volatility while investors regain their footing.
WCM Chart of the Week for November 25, 2019

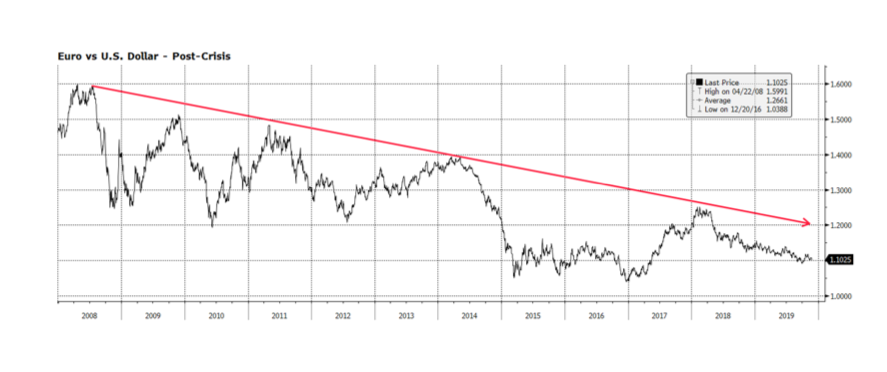
Christine Lagarde has taken the helm at the European Central Bank from the highly regarded yet somewhat controversial Mario Draghi at the beginning of November.  While many view Draghi’s leadership as forcing the ECB to the limits of monetary policy, he was successful in maintaining the monetary union and the single currency at several critical points in time over the past decade.  Lagarde faces a formidable challenge inheriting a central bank that is divided in the direction of policy. Her legacy as a consensus builder may prove invaluable at this pivotal point in time.  In her debut speech last week, she emphasized the need for stronger domestic demand and fiscal policy in order to counter the evolving global trade balance.  If she is successful in convincing countries with budget surpluses to spend and invest through fiscal stimulus, the region may see stronger economic activity and a firmer Euro which has been in a downtrend versus the US Dollar since the financial crisis.  The world needs a stronger, more resilient Europe and we believe Christine Lagarde will be an ideal leader of the ECB. [chart courtesy Bloomberg LP © 2019]