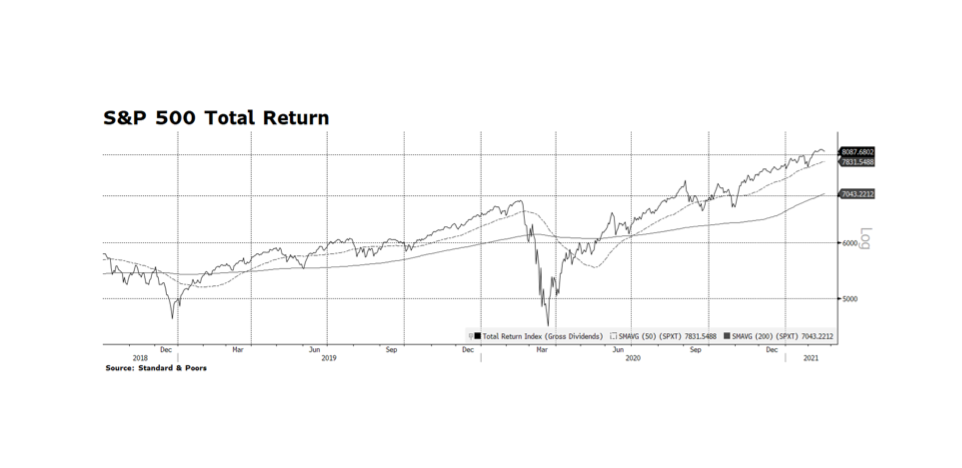
As we pass through the 12-month mark of the pandemic-caused rout in equities and risk assets across the world, investors are concerned about stretched stock market valuations, tight investment grade and high yield credit spreads, rising interest rates and poor labor market conditions. As of February 22nd, the one-year total return on the S&P 500 is just over 18% which is significant by any historical measure. As the next month or so passes, and as long as equity prices stay near where they are now, trailing returns are likely to grow even stronger as the anniversary of the March 23rd market bottom approaches. This may provide an additional psychological boost for investors as more stimulus is poured into the economy. Our concern is that the tremendous forthcoming stimulus now being debated in Congress might not be fully needed, or at least might not be properly apportioned. The stimulus may propel stocks higher here and abroad but may force the US Fed, which remains the dominant force in global capital markets, to reign in liquidity sooner than the market anticipates. [chart courtesy Standard & Poors and Bloomberg LP ©2021]
Category: Equities (Page 2 of 4)
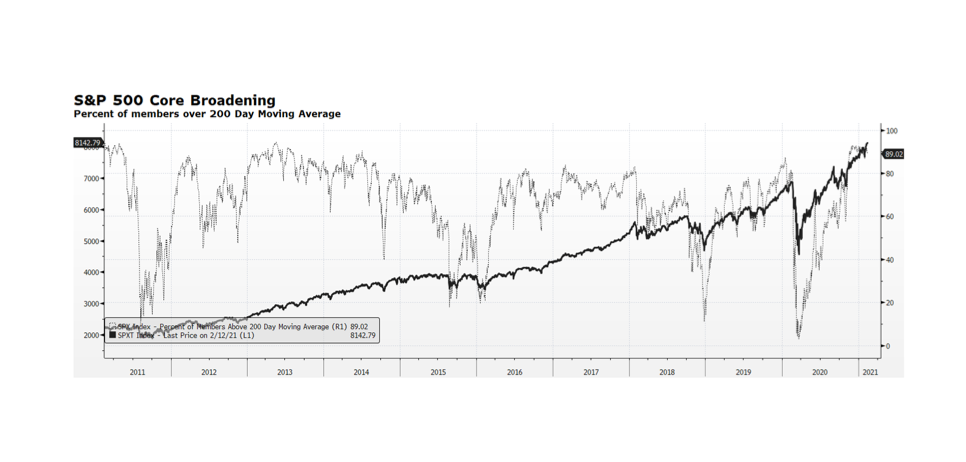
Investors are concerned that US equity market levels are reaching new all-time highs and valuation readings continue to be stretched. Several months ago narrow leadership within US stocks was the reason to justify underexposure to the asset class. Market participation has broadened considerably since the pandemic-caused nadir of 2020 as equity prices have climbed. One measure of greater market participation is the percentage of stocks trading above their long-term trends, depicted as the dotted line in the chart, revealing 89% of the S&P 500 universe trading above their 200-day moving average. While the current level of participation is high, it can persist for prolonged periods as it had over the past decade. The 2010s were a period of slow economic and job growth post-financial crisis, and yet equity prices delivered robust gains during times of high participation, only temporarily interrupted by bouts of Euro-related uncertainty, the US Treasury debt downgrade, and the “Taper Tantrum”. Given the amount of monetary and fiscal support pledged by the Fed and Congress, our sense is that US stock prices could maintain their general upward trend even in the face of more near-term challenges. [chart courtesy Bloomberg LP, © 2021]
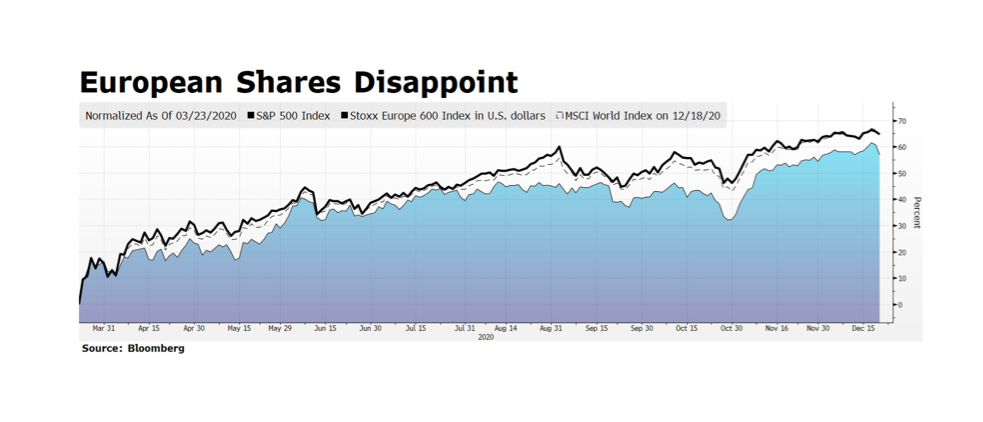
European equities have been rallying yet continue to lag the US and the rest of the world. Since global equities found their pandemic-induced bottom on March 23rd, both the S&P 500 and the MSCI World Indices have rallied over 65% as of last week’s closing levels (12/18/2020) while European shares have climbed just over 60% measured in US dollar terms. While a 60% recovery in approximately three quarters is impressive, it is masked due to currency movement over the period. The Eurostoxx 600 itself has climbed 44% in local currency terms from March 23rd through Friday’s close, and the Euro has rallied over 17% since March 23rd. The disparity in performance suggests a few things to us. First, European investors may have less confidence in their stock markets due to a lack of forceful coordinated continental response to the pandemic. Second, the currency tailwinds for European shares reflect more of a “retreat” from the pandemic flight-to-safe-haven currencies like the Dollar than true economic resiliency. Finally, we are particularly mindful that other stock markets beyond Europe may offer superior growth prospects, which would be especially attractive in a low-growth developed West.
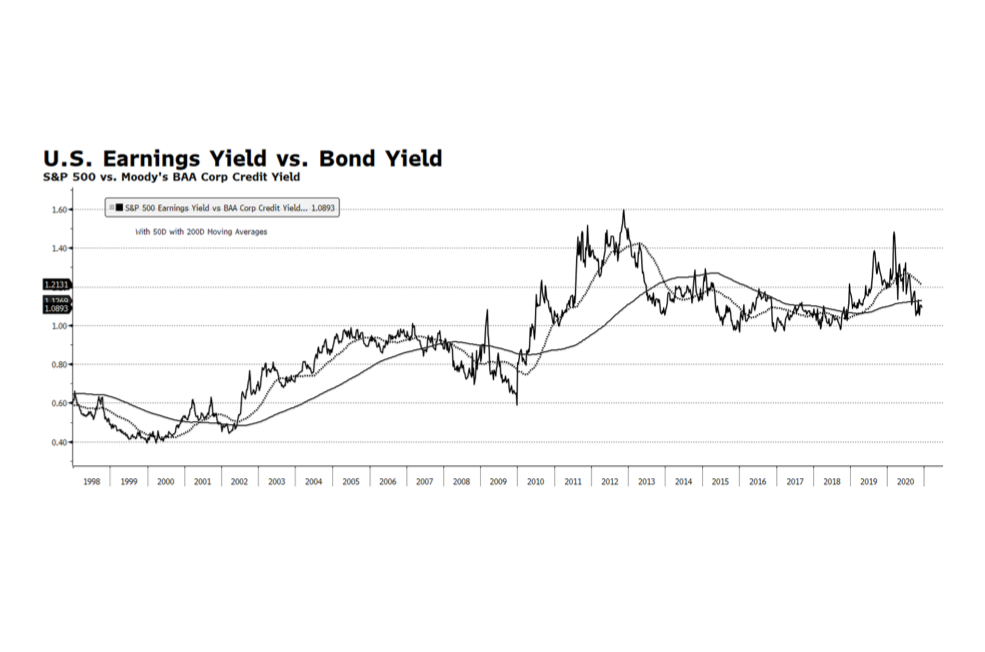
US stock market indices are trading near all-time highs and many market observers are highlighting valuation measures that are reaching levels last seen during the dot-com era. The bellwether S&P 500 is currently approaching a forward price to earnings ratio of 26 times consensus earnings while other key metrics such as price-to-cash flow and price-to-book are also well above their long-term trends. This is a cause of concern but not necessarily alarm even as valuations stand at premiums compared to the rest of the developed world. The Fed model which compares the S&P earnings yield to the yield on BAA US Corporate Credit is registering readings near its long-term average after reaching extremely attractive levels at the onset of the pandemic. A major tailwind for US equities is likely to be a continued benign interest rate environment heading into 2021 and perhaps beyond. The US Federal Reserve has signaled accommodative policy conditions perhaps reaching well into 2022 and fiscal policy remains supportive as well. Both policy positions should be supportive of US stocks in the intermediate term. [chart courtesy Bloomberg LP © 2020]
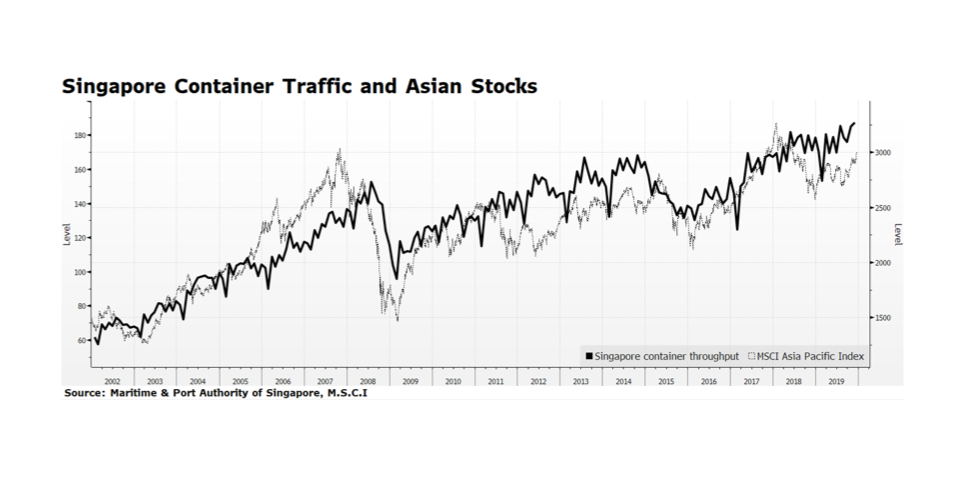
Trade flow in Asia is maintaining momentum after rebounding from the pandemic-caused low in February. Container traffic in Singapore has recently reached an all-time high level which many see as a proxy for trade in the region (or even the world) given its unique geographical location and distribution capacity. Improving economic trends in the region are also reflected in stock prices. The MSCI Asia Pacific Index, which includes both developed and emerging equity markets, is leading global equities. The total return of the index is up 13.4% compared to the 9.5% return for FTSE All Cap Global Index so far this year through November 20, 2020. We view this as potentially a good omen for global equities because it may signal that the equity rally is broadening beyond the US. [data courtesy Maritime & Port Authority of Singapore, MSCI; chart courtesy Bloomberg LP © 2020]
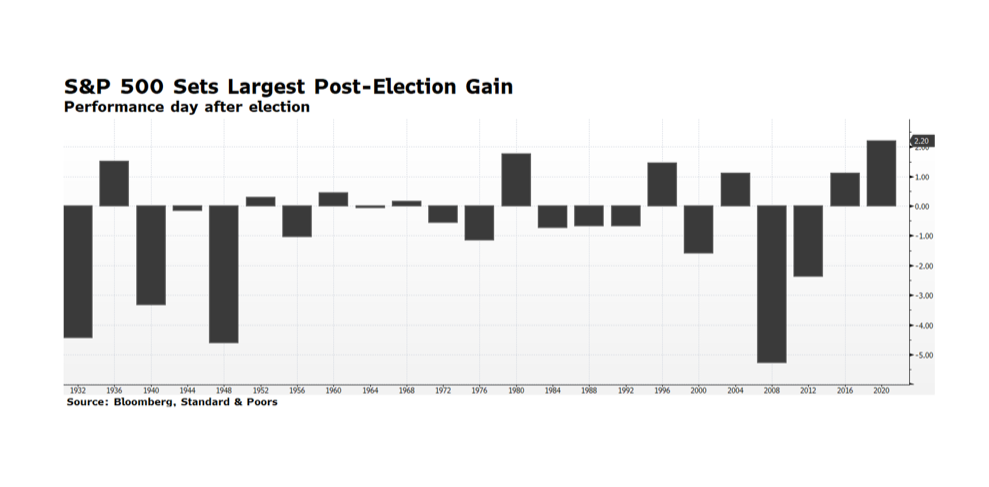
US equity markets have rallied strongly in the days following the national elections. According to Bloomberg, the S&P 500 delivered its largest day-after-election gain in history — 2.2%. This may seem perplexing because the outcome of the presidential election and even some congressional seats are yet to be finalized and markets generally fear uncertainty. It appears that Democrats will maintain control of the House of Representatives and the Senate will remain under Republican leadership while both majorities will likely be less dominant. The Electoral College does not cast its 538 votes until the first Monday following the second Wednesday in December (Dec. 14, 2020), and a lot of work is yet to be done and lawsuits to be filed in battle ground states between now and then. In light of the political uncertainty the positive tone in US equity markets can be explained by several factors.
First, the balance in Congress is likely to lead to no drastic change in US tax rates as any proposed increase would stall in the Senate. The same would likely result from any major proposed change to US energy policy. Markets generally respond favorably to policy certainty, or at least stability. Second, another round of stimulus will likely be delivered at some point before the end of the year. This tranche of spending or relief will likely be more targeted to the areas of the economy most impacted by the deadly effects of COVID-19. Meanwhile the Fed will remain accommodative. Markets thrive with generous stimulus. Third, the US economy is rapidly recovering. As many expected, the US economy rebounded strongly in the third quarter, exceeding economists’ forecasts. The BEA reported GDP grew at a 33.1% annualized rate while the consensus estimates stood at 32.0% prior to the announcement. Finally, the labor market continues to improve with October employment posted as a +638,000 change in payrolls and unemployment falling to 6.9%, both better than consensus expectations.
WCM has made some changes to our monthly newsletter to make it more engaging and useful for our readers. First, we have moved our interpretive analysis of the month gone by to the front and expanded it. We follow that with our current portfolio positioning and what we see as the capstone risks to our stance. Lastly, we close with a performance survey of capital markets for the prior month, calling out what we see as the most consequential returns which played into both our thinking and our results.
As always, you can find our latest newsletter in the Library, along with an archive of prior newsletters. Thank you for reading!
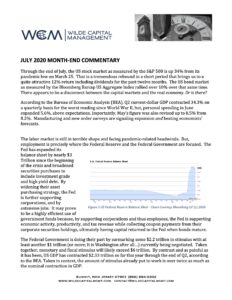
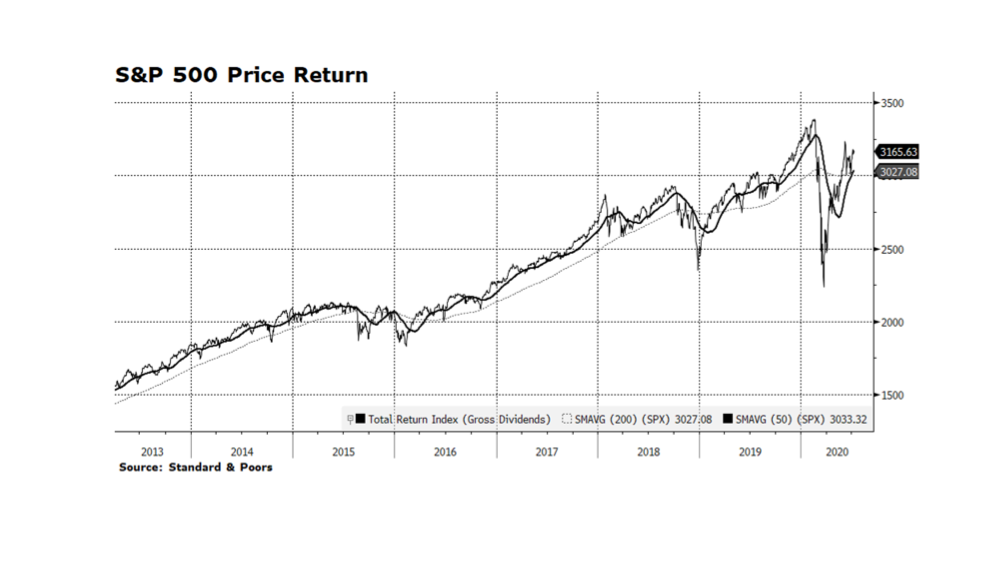
Equities in the US have been rallying since late March. The total return of the S&P 500 is 41.7% from the crisis trough on March 23 through July 9. The recovery in stocks has been among the swiftest in history and has caught many market participants underinvested during this uncertain pandemic period. Even with tremendous stress in the labor market, the overall economy and current corporate earnings, the S&P 500 price level has produced a widely followed bullish technical pattern know as a “golden cross” after Thursday’s close. This formation occurs when two key trend lines, the 50-day and 200-day moving averages, intersect while trending upwards. Generally, this condition needs to be supported by other factors, such as the powerful fiscal and monetary stimulus which we have been highlighting for the past several months, as the main reason markets have been rebounding. Another positive development is influential investment research organizations have begun to increase corporate earnings expectations for 2021. There are still well-known risks including the ebb and flow of the global pandemic and China-related tensions with the rest of the world. We expect volatility in the capital markets emanating from these and other factors, but equities, particularly in the US, will grind higher. Chart courtesy Bloomberg LP and Standard & Poors (c) 2020.
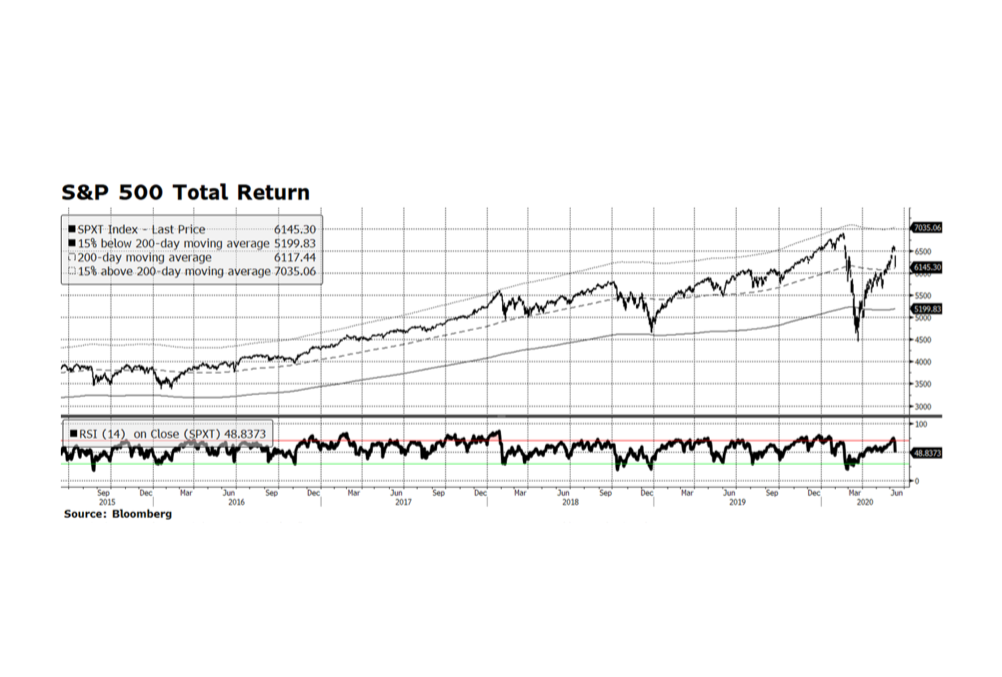
The main equity indices in the US were routed this past Thursday, making the week negative for the first time in three. The decline was likely due to concerns about climbing rates of COVID-19 in new parts of the country, and comments made by the Chairman of the US Federal Reserve (Powell) regarding the economic challenges ahead. Thursday’s sell-off was the worst in percentage terms for the S&P Total Return Index since March 16, a week before the gauge made its cyclical bottom. Another factor may have been that the US equity market was extended heading into the week. Still, on Thursday the index managed to close above the 200-day moving average, and on Friday rebounded 1.3%. Prior to Thursday, the index was elevated well above that long-term measure, so some give back was reasonably expected. Friday’s gain is encouraging but we are mindful of the real challenges facing the US economy and capital markets going forward. The next several trading days will be telling. [chart courtesy S&P and Bloomberg LP © 2020]
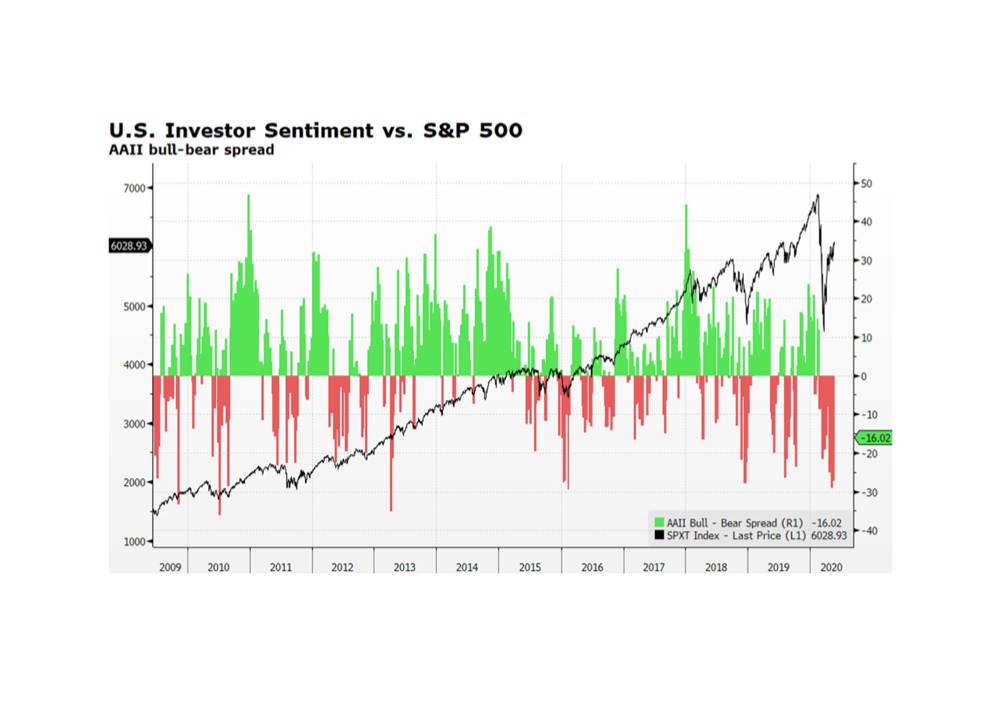
A key contrarian indicator sustains bullish readings, at least for the time being. The American Association of Individual Investor bull-bear spread survey continues to post negative readings, which is not surprising given the dire news on the US economic front. The labor market alone shows initial jobless claims approaching 40 million. Positive economic indicators are rare, yet US stocks continue to rebound, establishing higher highs and higher lows. Equity investors, for now, are looking past day-to-day bad news and towards the recovery as the country re-opens. There are still risks as new consumption patterns emerge and the potential for a second wave of COVID-19 looms later in the year, but the repatriation of American manufacturing and key service functions will likely lead to higher median wages, greater sustainability, and stronger national security. These long-term trends, in our view, will continue to attract the marginal global investment dollar to the US capital markets. [Chart courtesy Bloomberg LP (c) 2020]