Category: Chart of the Week (Page 17 of 18)

WCM Chart of the Week for June 19, 2018

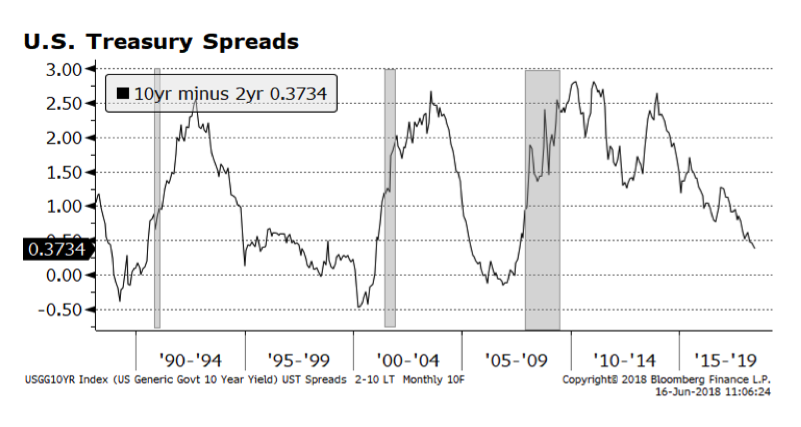
US Treasury Spreads Continue to Narrow

Interest rate spreads in the US Treasury market are continuing — a major concern for investors over the past several quarters. This week’s chart shows the difference between 10-year and 2-year US Treasury yields with the shaded areas marking recessionary periods. As these two yields converge, or when the yield on the 2-year surpasses the 10-year yield, recessions often follow. The current spread is 37 basis points, but it is heading towards parity rapidly. It is difficult to forecast an imminent recession because of the positive trends in employment, consumer and business spending, benign inflation and expansionary fiscal activity. Yet this indicator has strong predictive power and should not be ignored. One major difference in this cycle versus previous ones is the amount of central bank activity throughout the world and as a result treasury spreads might not have the same predictive force as before.

WCM Chart of the Week for June 12, 2018

Ooooh. Color! This week’s focus is on major central bank activity with the European Central Bank (ECB), the US Federal Reserve and the Bank of Japan (BoJ) all scheduled to make policy announcements at the conclusion of their respective meetings. Beginning Wednesday with the US Fed, market observers are widely expecting a further 0.25% increase in the Federal funds rate but the focus will be on which words are selected and projections going forward. The ECB follows on Thursday and the key to their statement will be any adjustments they intend to make regarding the bond buying program and the impact on the balance sheet, pictured below. The BoJ closes out the week on Friday and market participants are largely expecting no change to current policy given inflation is below target and the tightening labor market does not appear to be adversely impacting prices.

WCM Chart of the Week for June 6, 2018

We’re back to charts after a holiday week hiatus, but Italy didn’t take a break. Another Euro-related crisis may be lurking in Italy as the populist coalition government, consisting of the Five Star Movement and the far-right League parties, have formed an administration. Although the parties have dropped some of their most alarming campaign rhetoric concerning exiting the Euro and EU, investors have re-focused on Italy’s sovereign debt levels now surpassing 130% of GDP (well beyond EU budget rules) and the limitations it imposes on fiscal flexibility.

Not surprisingly, the Euro has weakened considerably — particularly against the US Dollar. The cause of the softening Euro likely spans beyond Italy’s contribution of 15% EU GDP. Several key Eurozone economic indicators such as industrial production, business sentiment and consumer confidence appear to be losing momentum.

WCM Chart of the Week for May 16, 2018

The yield on the widely followed benchmark 10 Year US Treasury bond eclipsed 3.05% Tuesday morning May 15th and now stands at levels last seen in 2011. The rise in April’s retail sales report showing further expansion likely helped push rates higher. Stronger economic activity and the potential for inflation are forces potentially putting upward pressure on interest rates, but record Treasury bond issuance is also a highly influential factor in the other direction.

We believe interest rates will continue to rise as the US Federal Reserve pursues monetary policy normalization and the economy expands. As a result, our fixed income positions remain short duration. Bloomberg’s survey of 58 analysts projects the yield on the 10 Year US Treasury bond should reach 3.19% by the end of 2018 which would imply further price declines in longer duration fixed income.

WCM Chart of the Week for May 8, 2018

Last week’s unemployment figures released by the US Bureau of Labor Statistics were further signs that the labor market as well as the overall economy continue to improve. Headline unemployment is at the lowest level since the technology boom fueled 1999-2000 period. Unemployment including part time workers is approaching levels experienced during that same timeframe. While this is good news for the American worker, the market is concerned that labor scarcity could place upward pressure on wages, inflation and ultimately interest rates. Right now, nominal wage inflation is contained at 2.6%, a level the Federal Reserve has indicated to be tolerable.

WCM Chart of the Week for May 2, 2018

US Dollar strength caught some investors off guard recently as Bloomberg’s DXY index, which measures the dollar versus a basket of major currencies, has risen some 3% over the past three months. Dollar strength could persist if interest rates continue to rise in the US as monetary policy continues to firm, as many including us expect. Meanwhile, central bankers abroad, notably the ECB and BOJ, will likely remain more accommodative given weaker economic conditions—ECB President Draghi indicated as much last week in his post-ECB meeting remarks. The result could be further widening of interest rate spreads across government bond markets.

The strength/weakness of the US dollar represented by DXY, the red line on the chart below, appears to be related to Global government bond spreads among US Treasuries, U.K. Gilts, ECB Bonds and JGBs. Spreads contracted from 2006 until the financial crisis during a period of dollar weakness. The dollar rebounded in the aftermath of the crisis, and over the past decade of extraordinary central bank intervention, the relationship between global spread differentials and the value of the dollar appears to be influential.

WCM Chart of the Week for March 22, 2018

Larry Kudlow was appointed by President Trump as Director of the National Economic Council, replacing the widely respected Gary Cohn. Kudlow, a former Federal Reserve and Wall Street economist and most recently a television host on financial news network CNBC, has raised some eyebrows with his comments regarding his support for a strong dollar. The dollar has been in a downward trend against a basket of major currencies since the beginning of 2017, although it has strengthened modestly over the past month or so. Weakness may have been more related to economic repair or the regaining of lost ground for the rest of the world versus the US. We view that as positive for the global economy and not necessarily a bad thing for the US. Corporate US fundamentals – most notably earnings growth – are robust and should support securities prices going forward. But, a stronger dollar could place downward pressure on earnings and serve as a headwind.

WCM Chart of the Week for March 5, 2018

Equities in the Eurozone have had difficulty keeping pace with their global peers. There have been many encouraging signs on the economic front within the common currency zone, stock market valuation measures remain attractive compared to peers, and the interest rate outlook remains stable, yet regional shares continue to lag. One reason may be that consensus earnings expectations were inflated and are now being adjusted lower. (Chart courtesy of and copyright Bloomberg Finance LP 2018)

Remember to follow us on LinkedIn, Facebook and Instagram to get our Chart of the Week and other timely content delivered directly to your smartphone.

WCM Chart of the Week for February 28, 2018

Stock markets around the world have been gyrating in response to higher interest rates – particularly in the United States. Long-term US Government bond yields have increased significantly over the course of the past year and a half. Yields on the 10 and 30 year US Treasuries have recently reached levels that some market participants believe may become headwinds for equities. While recent advances have been steep, interest rates are still well below what would be considered “normal levels” which would imply more volatility in corporate securities markets across the globe.

Chart of the Week for February 20, 2018

US stocks have regained their footing relative to US fixed income and have resumed their capital market leadership. Stock prices in the US have rebounded from their February 8th low while upward trending interest rates have been an obvious headwind for bonds. The higher interest rate environment, while widely anticipated by some for several years, may be a formidable challenge for equities both here and abroad. In our view, as long as interest rates rise at a moderate pace, equities should continue to advance and the global economic expansion should remain intact.

We would point out, however, that we are in the early stages of the recovery and the market may yet shake investors’ confidence in coming sessions.

Don’t forget to follow us on Instagram, Facebook and LinkedIn to get the COTW in your social media feed.


« Older posts Newer posts »