Page 8 of 28

WCM Chart of the Week for January 4, 2021

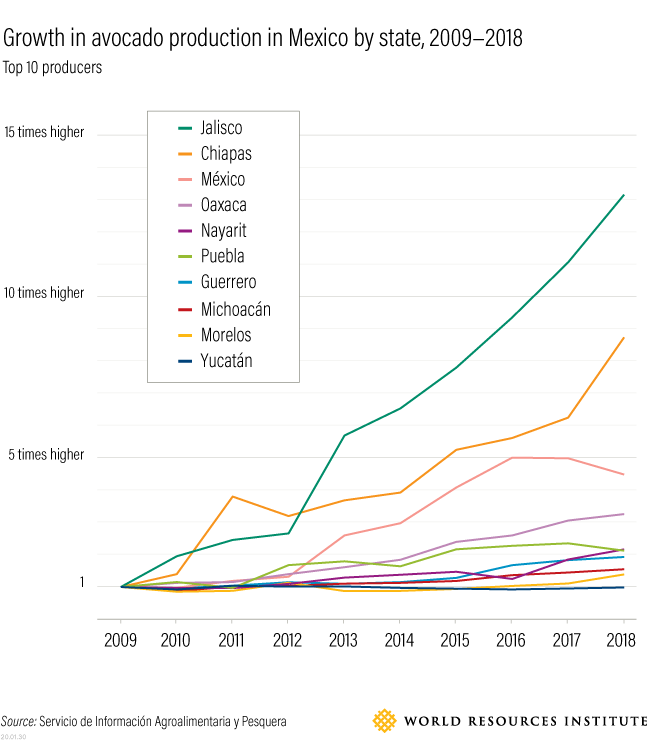
What happens when one ESG priority comes into conflict with another? This week we examine a chart from the World Resources Institute (www.wri.org) of data from the Servicio de Información Agroalimentaria y Pesquera chronicling a decade of growth in avocado production in Mexico. Avocados play on ESG themes of healthy eating, job creation and economic opportunity. Unfortunately, the explosion of consumption, primarily in the US as a result of NAFTA, of Mexican avocados has fueled deforestation, draining of aquifers, soil degradation, increased CO2 emissions, threatens indigenous species and even triggers small earthquakes. According to various studies assembled by the World Economic Forum, avocado groves consume multiples of the water of indigenous forest, and the fruit has an end-point carbon emissions footprint many times that of bananas. As with other monocultures like palm in Indonesia, avocado has brought economic opportunity to areas that badly need it like Michoacán province, but at a profound and unsustainable cost. Conscientious consumption and deploying capital to find more sustainable methods of cultivation without depriving Michoacán of needed money and opportunity are examples of where ESG is headed to address whole-systems challenges rather than focusing narrowly on single issues or ideas.
WCM Thanks of the Week/Year for December 28, 2020

As the sun sets on 2020, we want to extend our gratitude and appreciation for our amazing clients, partners, vendors, friends and colleagues. It was quite a ride, and we are thankful to have taken it with you. We will take a break from the weekly charts to leave room for both celebration and contemplation about the challenges and opportunities in front of all of us in the new year. Wishing everyone a terrific holiday season, and a happy, HEALTHY, and prosperous new year. The COTW will return in January!

WCM Chart of the Week for December 21, 2020

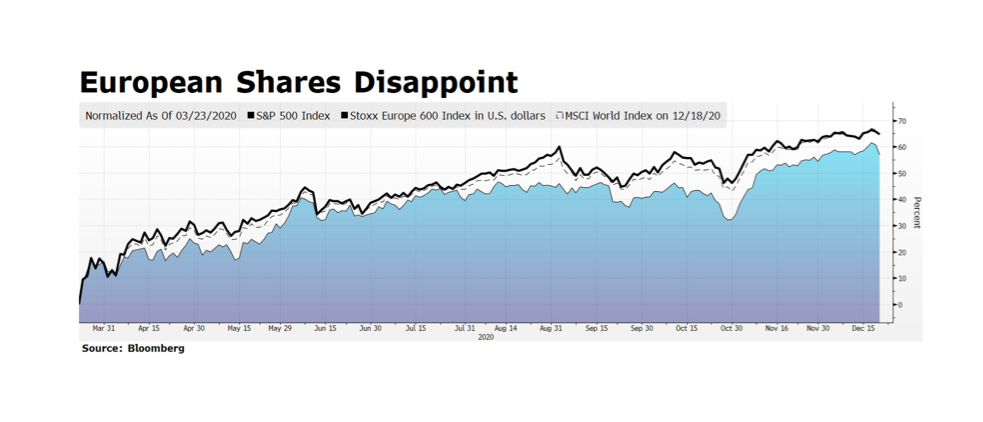
European equities have been rallying yet continue to lag the US and the rest of the world. Since global equities found their pandemic-induced bottom on March 23rd, both the S&P 500 and the MSCI World Indices have rallied over 65% as of last week’s closing levels (12/18/2020) while European shares have climbed just over 60% measured in US dollar terms. While a 60% recovery in approximately three quarters is impressive, it is masked due to currency movement over the period. The Eurostoxx 600 itself has climbed 44% in local currency terms from March 23rd through Friday’s close, and the Euro has rallied over 17% since March 23rd. The disparity in performance suggests a few things to us. First, European investors may have less confidence in their stock markets due to a lack of forceful coordinated continental response to the pandemic. Second, the currency tailwinds for European shares reflect more of a “retreat” from the pandemic flight-to-safe-haven currencies like the Dollar than true economic resiliency. Finally, we are particularly mindful that other stock markets beyond Europe may offer superior growth prospects, which would be especially attractive in a low-growth developed West.

WCM Chart of the Week for December 14, 2020

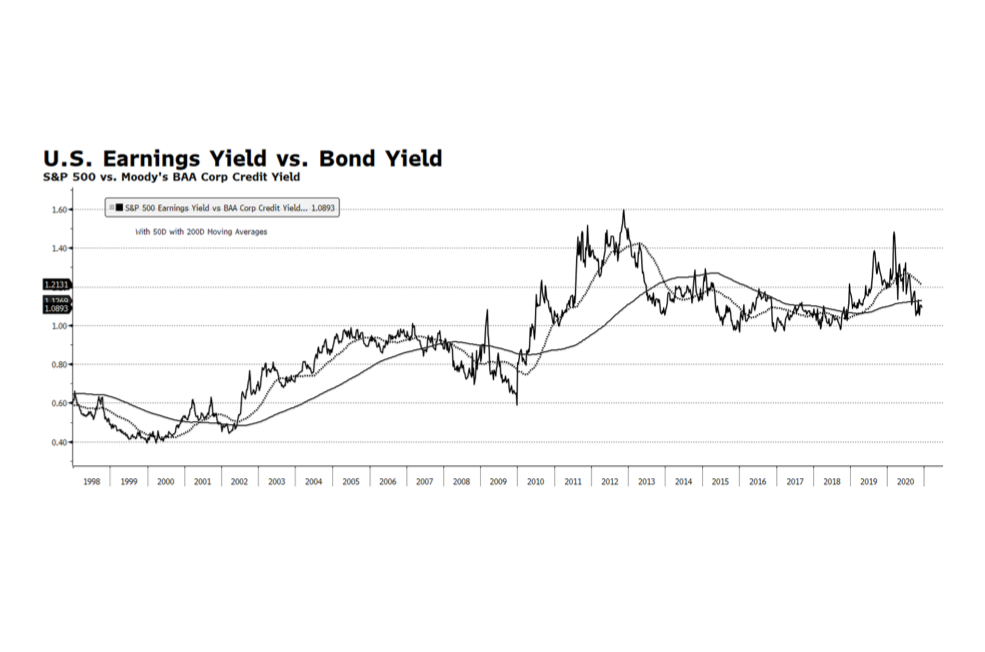
US stock market indices are trading near all-time highs and many market observers are highlighting valuation measures that are reaching levels last seen during the dot-com era. The bellwether S&P 500 is currently approaching a forward price to earnings ratio of 26 times consensus earnings while other key metrics such as price-to-cash flow and price-to-book are also well above their long-term trends. This is a cause of concern but not necessarily alarm even as valuations stand at premiums compared to the rest of the developed world. The Fed model which compares the S&P earnings yield to the yield on BAA US Corporate Credit is registering readings near its long-term average after reaching extremely attractive levels at the onset of the pandemic. A major tailwind for US equities is likely to be a continued benign interest rate environment heading into 2021 and perhaps beyond. The US Federal Reserve has signaled accommodative policy conditions perhaps reaching well into 2022 and fiscal policy remains supportive as well. Both policy positions should be supportive of US stocks in the intermediate term. [chart courtesy Bloomberg LP © 2020]

WCM Chart of the Week for December 7, 2020

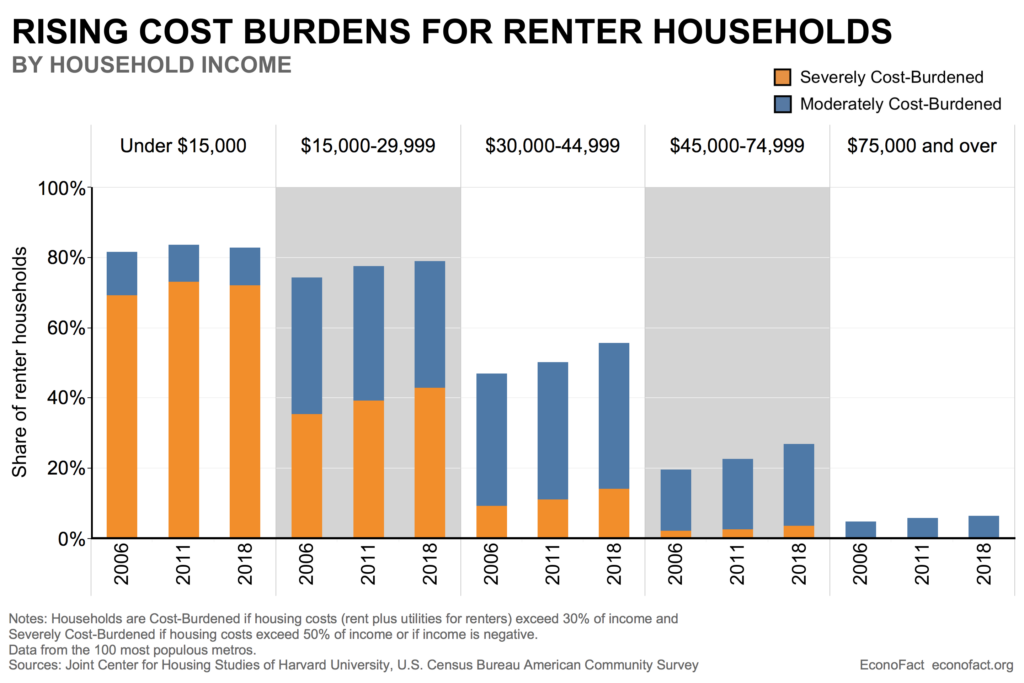
This week we are in the midst of examining the likelihood of a pandemic-induced housing crisis and its effects on families, the economy, and markets.  As we learned during the Financial Crisis, it is a very slow process to foreclose on a mortgagee and remove them from a home, particularly when there is a massive backlog of borrowers in similar circumstances. Renters, on the other hand, are more immediately vulnerable to eviction and subsequent homelessness. This week’s chart from econofact.org illustrates the percentage of households suffering a moderate or extreme cost-burden of rent (30% to 50% of income) by household income tier. These observations are pre-COVID, so we can reasonably expect this picture to be much worse in 2020. Government-issued moratoria on evictions kept people in their homes but also shifted the economic burden to the literal doorstep of landlords, many of whom are small businesses. As those edicts roll off but the pandemic still rages in the coming months, landlords will of necessity pursue their economic and business interests and housing insecurity will jump. Whether it is on the backs of the landlords or the renters, the social and economic consequences of this income and housing crisis will play out in our communities, in the real economy and in the investment markets for some time to come.

WCM Chart of the Week for November 30, 2020

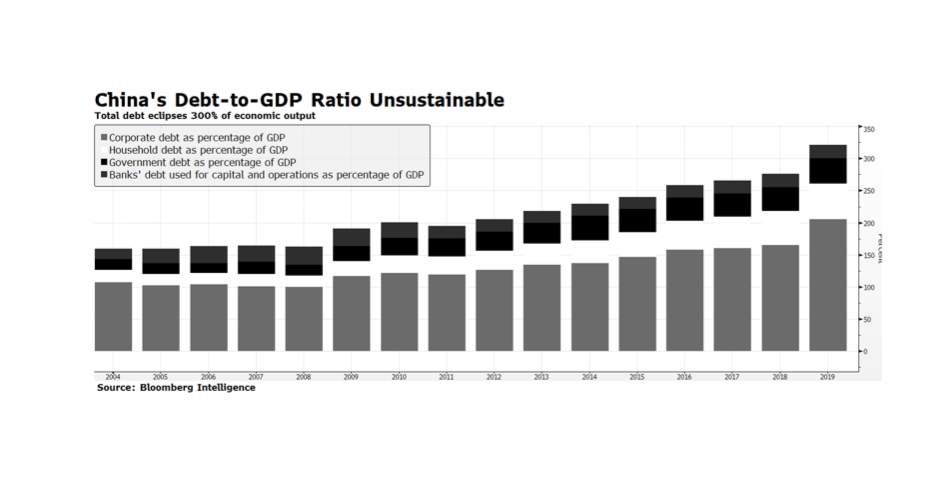
Beyond the rosy headlines of a strong economic recovery and a rally of over 40% in the Shanghai Shenzhen CSI 300 Index from the depths of the pandemic, trouble may be brewing in China’s bond markets. Total debt in China was approaching 325% of GDP in 2019, a point that economies generally struggle. The largest segment of total debt growth from 2018 to 2019 was in the corporate sector, which rose from 165% to 205% of GDP. China’s 2019 corporate debt binge appears to have hit a wall. According to Chinese media reports as much as 69% of private enterprises have defaulted on their outstanding loans so far in 2020 and the festering crisis may impact local governments and state enterprises as well. Further deterioration in the Chinese financial system would obviously have negative implications for the rest of the world.

WCM Chart of the Week for November 23, 2020

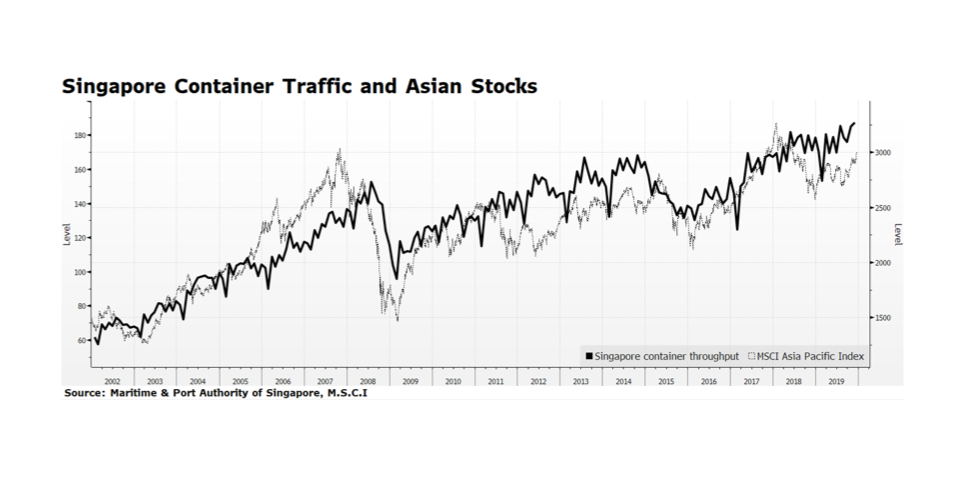
Trade flow in Asia is maintaining momentum after rebounding from the pandemic-caused low in February. Container traffic in Singapore has recently reached an all-time high level which many see as a proxy for trade in the region (or even the world) given its unique geographical location and distribution capacity. Improving economic trends in the region are also reflected in stock prices.  The MSCI Asia Pacific Index, which includes both developed and emerging equity markets, is leading global equities. The total return of the index is up 13.4% compared to the 9.5% return for FTSE All Cap Global Index so far this year through November 20, 2020. We view this as potentially a good omen for global equities because it may signal that the equity rally is broadening beyond the US. [data courtesy Maritime & Port Authority of Singapore, MSCI; chart courtesy Bloomberg LP © 2020]

WCM Chart of the Week for November 16, 2020

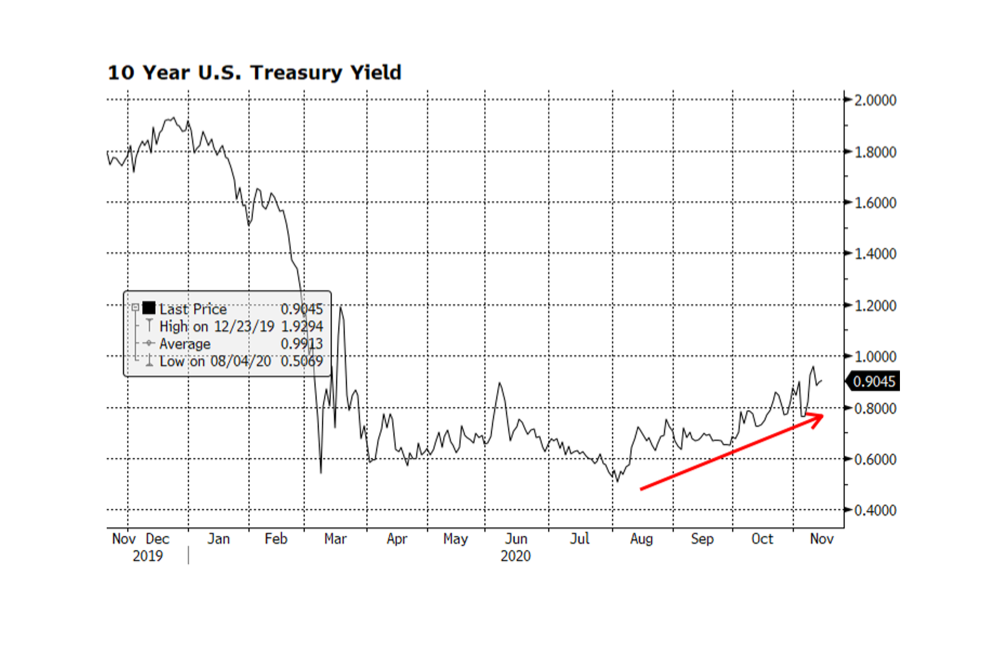
With US stock market indices across the capitalization spectrum at or above all-time highs, US Treasury yields have been grinding higher. Since early August, the yield on the benchmark 10-year Treasury has risen from an all-time low of 0.51% to 0.9%, forcing long-term US Treasury prices down over 7% since then according to the Bloomberg Barclays Long Term US Treasury Price Index. US stock prices have been rallying due to the announcements of highly effective COVID-19 vaccine trials, building economic momentum, clarity developing in the US political landscape and resilient as well as improving corporate fundamentals. We expect US interest rates will continue to normalize to pre-pandemic levels in coming quarters and that will likely keep downward price pressure on long term Treasuries. We expect this to be gradual given that comparable sovereign rates in Europe and Asia remain much lower or even negative. Overall conditions should be supportive for equities heading into 2021 even in the face of higher US Treasury yields. [chart courtesy Bloomberg LP © 2020]

WCM Chart of the Week for November 9, 2020

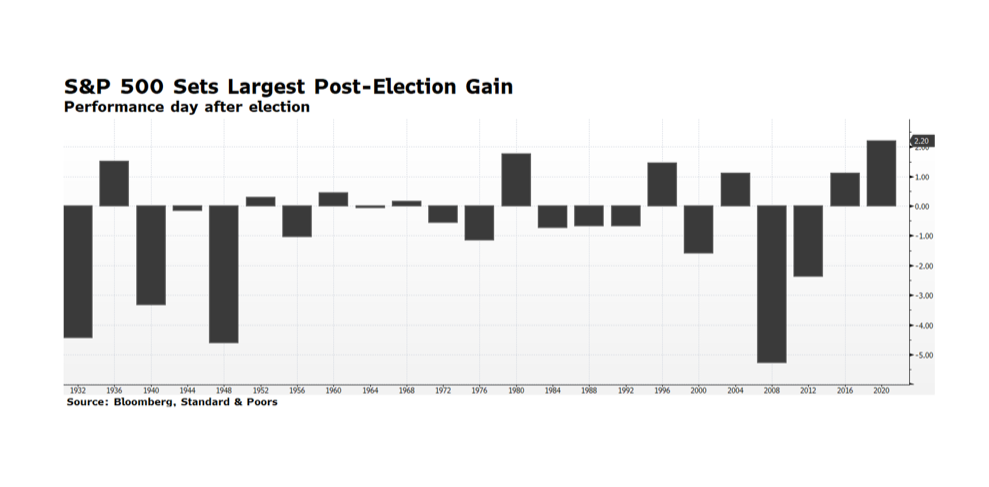
US equity markets have rallied strongly in the days following the national elections. According to Bloomberg, the S&P 500 delivered its largest day-after-election gain in history — 2.2%. This may seem perplexing because the outcome of the presidential election and even some congressional seats are yet to be finalized and markets generally fear uncertainty. It appears that Democrats will maintain control of the House of Representatives and the Senate will remain under Republican leadership while both majorities will likely be less dominant. The Electoral College does not cast its 538 votes until the first Monday following the second Wednesday in December (Dec. 14, 2020), and a lot of work is yet to be done and lawsuits to be filed in battle ground states between now and then. In light of the political uncertainty the positive tone in US equity markets can be explained by several factors. 

First, the balance in Congress is likely to lead to no drastic change in US tax rates as any proposed increase would stall in the Senate. The same would likely result from any major proposed change to US energy policy. Markets generally respond favorably to policy certainty, or at least stability. Second, another round of stimulus will likely be delivered at some point before the end of the year. This tranche of spending or relief will likely be more targeted to the areas of the economy most impacted by the deadly effects of COVID-19. Meanwhile the Fed will remain accommodative.  Markets thrive with generous stimulus. Third, the US economy is rapidly recovering.  As many expected, the US economy rebounded strongly in the third quarter, exceeding economists’ forecasts. The BEA reported GDP grew at a 33.1% annualized rate while the consensus estimates stood at 32.0% prior to the announcement. Finally, the labor market continues to improve with October employment posted as a +638,000 change in payrolls and unemployment falling to 6.9%, both better than consensus expectations.

WCM Chart of the Week for November 2, 2020

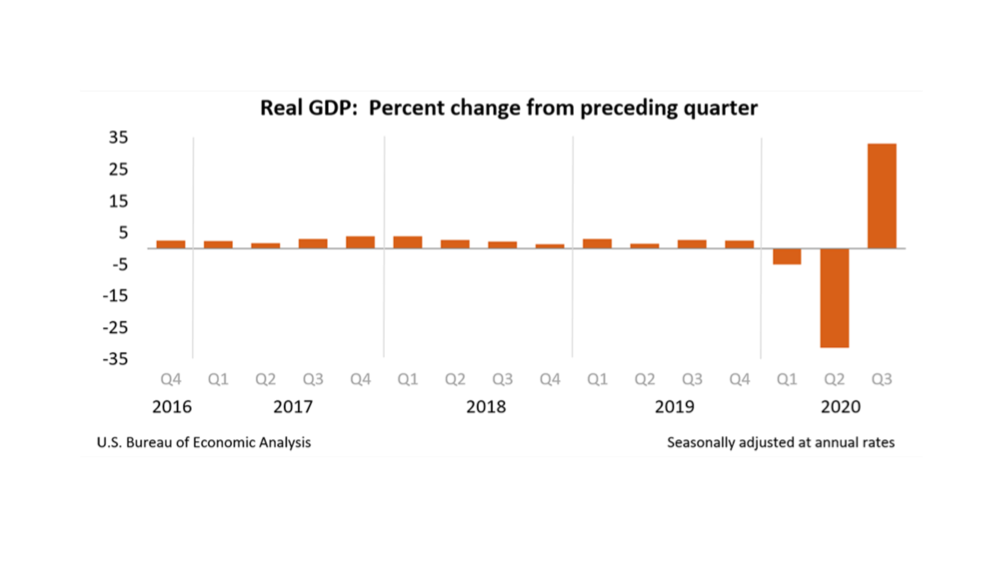
As many expected, the US economy rebounded strongly in the third quarter exceeding economists’ forecasts. The BEA reported GDP grew at a 33.1% annualized rate while the consensus estimates stood at 32.0% prior to the announcement. The rebound is quite welcomed in the wake of Q1 and Q2 contractions of 5.0% and 31.4% respectively. Strength was delivered across nearly all key sectors of the economy with the exception of Government Spending. Personal Consumption Expenditures, the largest segment of the economy, grew 40.7% (annualized) in Q3, highlighted by an 82.2% advance in Durable Goods. Gross Domestic Private Investment expanded at an 83% clip.  Exports and Imports also rebounded impressively. The recovery appears to be underway and the recent report is headline grabbing, but the level of GDP is still some 2.8% lower than at this point last year. The key to the trajectory going forward is in state and local lock downs which are lifted or reinstituted as confirmed COVID-19 cases are peaking across the nation. This introduces major uncertainty which, along with the lack of additional stimulus spending, have caused capital markets to become more volatile over the past several trading days. Stay tuned. We will.

« Older posts Newer posts »