Page 19 of 28

Start today, and give for the long term

Today is Giving Tuesday. Numerous worthwhile charities are raising their hands and asking for our attention and our dollars in pursuit of their missions. The difficulty with a one-day campaign is that, while it may bring in new dollars from existing donor relationships, there is a low probability of establishing durable relationships with new donors. Whether the connection is spiritual or practical, driven by a single crisis or by a lifelong pursuit, connecting givers with worthy recipients is a process. Not only does a donor, whether organization or individual, need to find that alignment of purpose, that donor also needs to go through some degree of due diligence to see whether the receiving organization is a good steward of donated capital and creating meaningful and measurable impact with it over time.

Let today not just be a flash in the pan, but let it be the start of an ongoing process for kind and caring individuals, families, and institutions to discover and build long term relationships with impactful organizations creating positive change in the world. As part of that, donors should also consider solutions that help create a platform for purposeful giving that could last months, years or even generations. Consider donor advised funds (DAFs), private foundations, community trusts, and other solutions that make it possible to institutionalize giving, make larger financial commitments that can be disbursed systematically, and provide partners and resources to help identify and evaluate potential recipients.

WCM Chart of the Week for Nov. 14, 2018

With the 2018 midterm elections behind us, volatility continues to persist in global equities with many investors questioning whether the long-term uptrend in US stocks has reached its end. We are constructive on US equities based on strong corporate fundamentals and a supportive economic backdrop. Furthermore, if history is a guide, equities typically produce positive 12-month returns after mid-term election cycles.

Historically, fourth quarter performance has been favorable albeit not uniformly positive. The chart below (courtesy of Bloomberg TV) shows Q4 total returns of the S&P 500 going back 30 years. There have only been five negative quarters since 1988 and the overall average is 4.8% with the steepest contractions following the dot com bubble bursting and during the financial crisis.

WCM Chart of the Week for Nov. 7, 2018

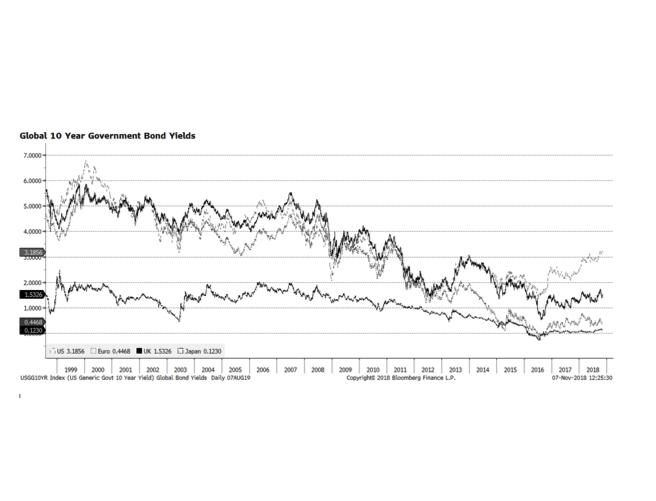
The US Federal Reserve is widely expected to continue on its pathway to higher policy rates at the December FOMC meeting. For the time being, the US economy appears that it can handle a more normal interest rate environment. Yet, economic conditions in the rest of the developed world — notably Japan and the Eurozone — remain sub-par at best and interest rates in those economies are stubbornly low. We wonder if the higher trajectory of interest rates in the US will force higher rates elsewhere internationally or will lower international rates keep US rates lower than normal. We would prefer the former because if that occurred it could happen concurrently with economic recovery in the rest of the world. This relationship is critical, in our view, because it will likely continue to influence currency and capital market volatility going forward.

WCM Chart of the Week for Oct. 30, 2018

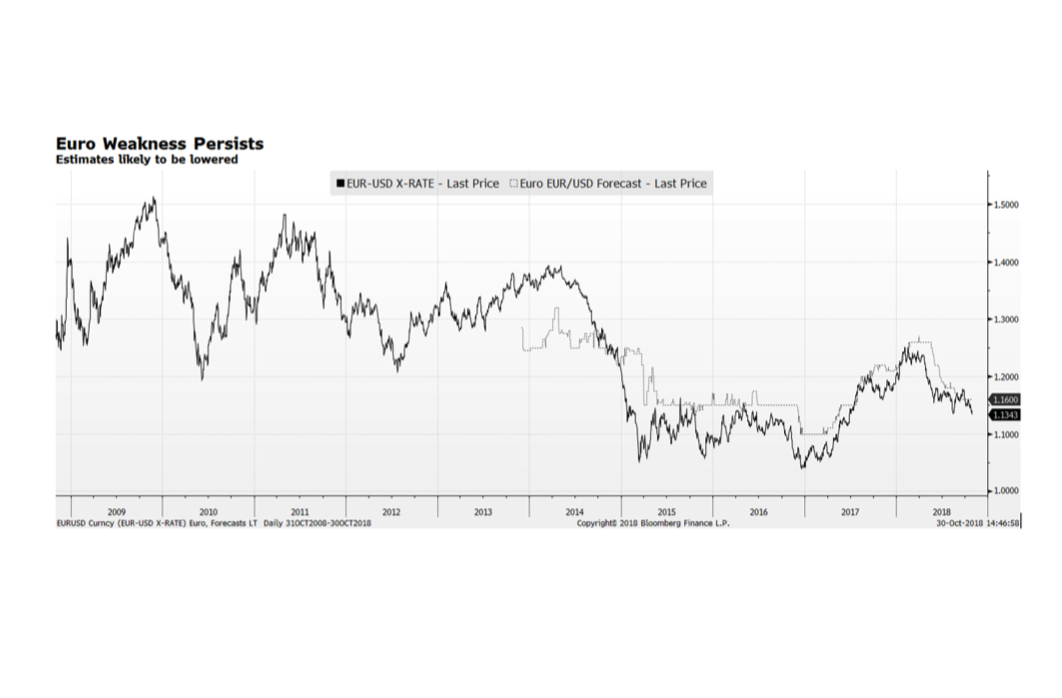
The euro has weakened considerably versus the US dollar this year and is currently testing support levels reached just a few months ago. Our concern is that there may be further weakness ahead as economic activity continue to be sluggish on the Continent – the key German economic engine appears to have stalled as the Bundesbank expects Q3 to exhibit zero growth although officials expect that to be temporary. Consensus forecasts (the dotted line on the chart below) may catch up to current prices placing further downward pressure on the currency. This is happening at a time when the ECB has indicated that it will begin to end quantitative easing exercises towards the end of the year.

WCM Chart of the Week for Oct. 24, 2018

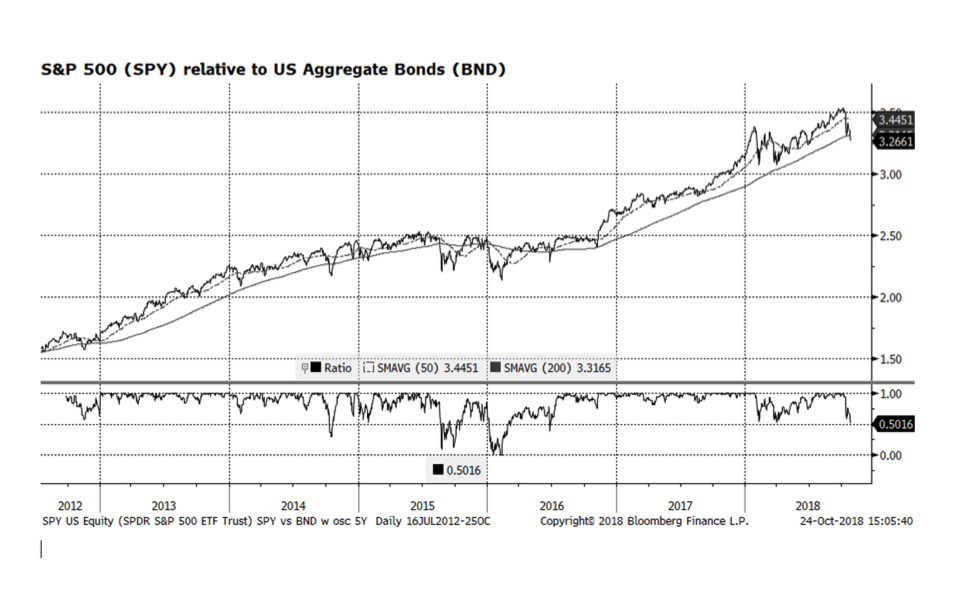
The first investment decision for many asset allocators – the US equity-vs.-fixed income relationship – has broken a key long-term trend and support level. The ratio of the S&P 500 and US Aggregate indices (we use ETFs as proxies because we can obtain real time intraday measures) has fallen below it’s 200-day moving average, which is making US stock prices vulnerable. The last time this occurred was in mid-2016 before stocks began their recent run of dominance. As we have been discussing for the past several months, economic conditions and US corporate fundamentals remain strong and are markedly different than the tug of war we experienced prior to the stock breakout that occurred in mid-2016. In our view, the market is adjusting to the mix of higher US interest rates and slowing economic growth in key regions. We are in the midst of US corporate earnings season with some key companies lowering earnings and revenue guidance, putting downward pressure on those stocks. We believe that the current market adjustment is healthy and we will see higher US equity levels as we head towards the end of the year.

WCM Chart of the Week for October 17, 2018

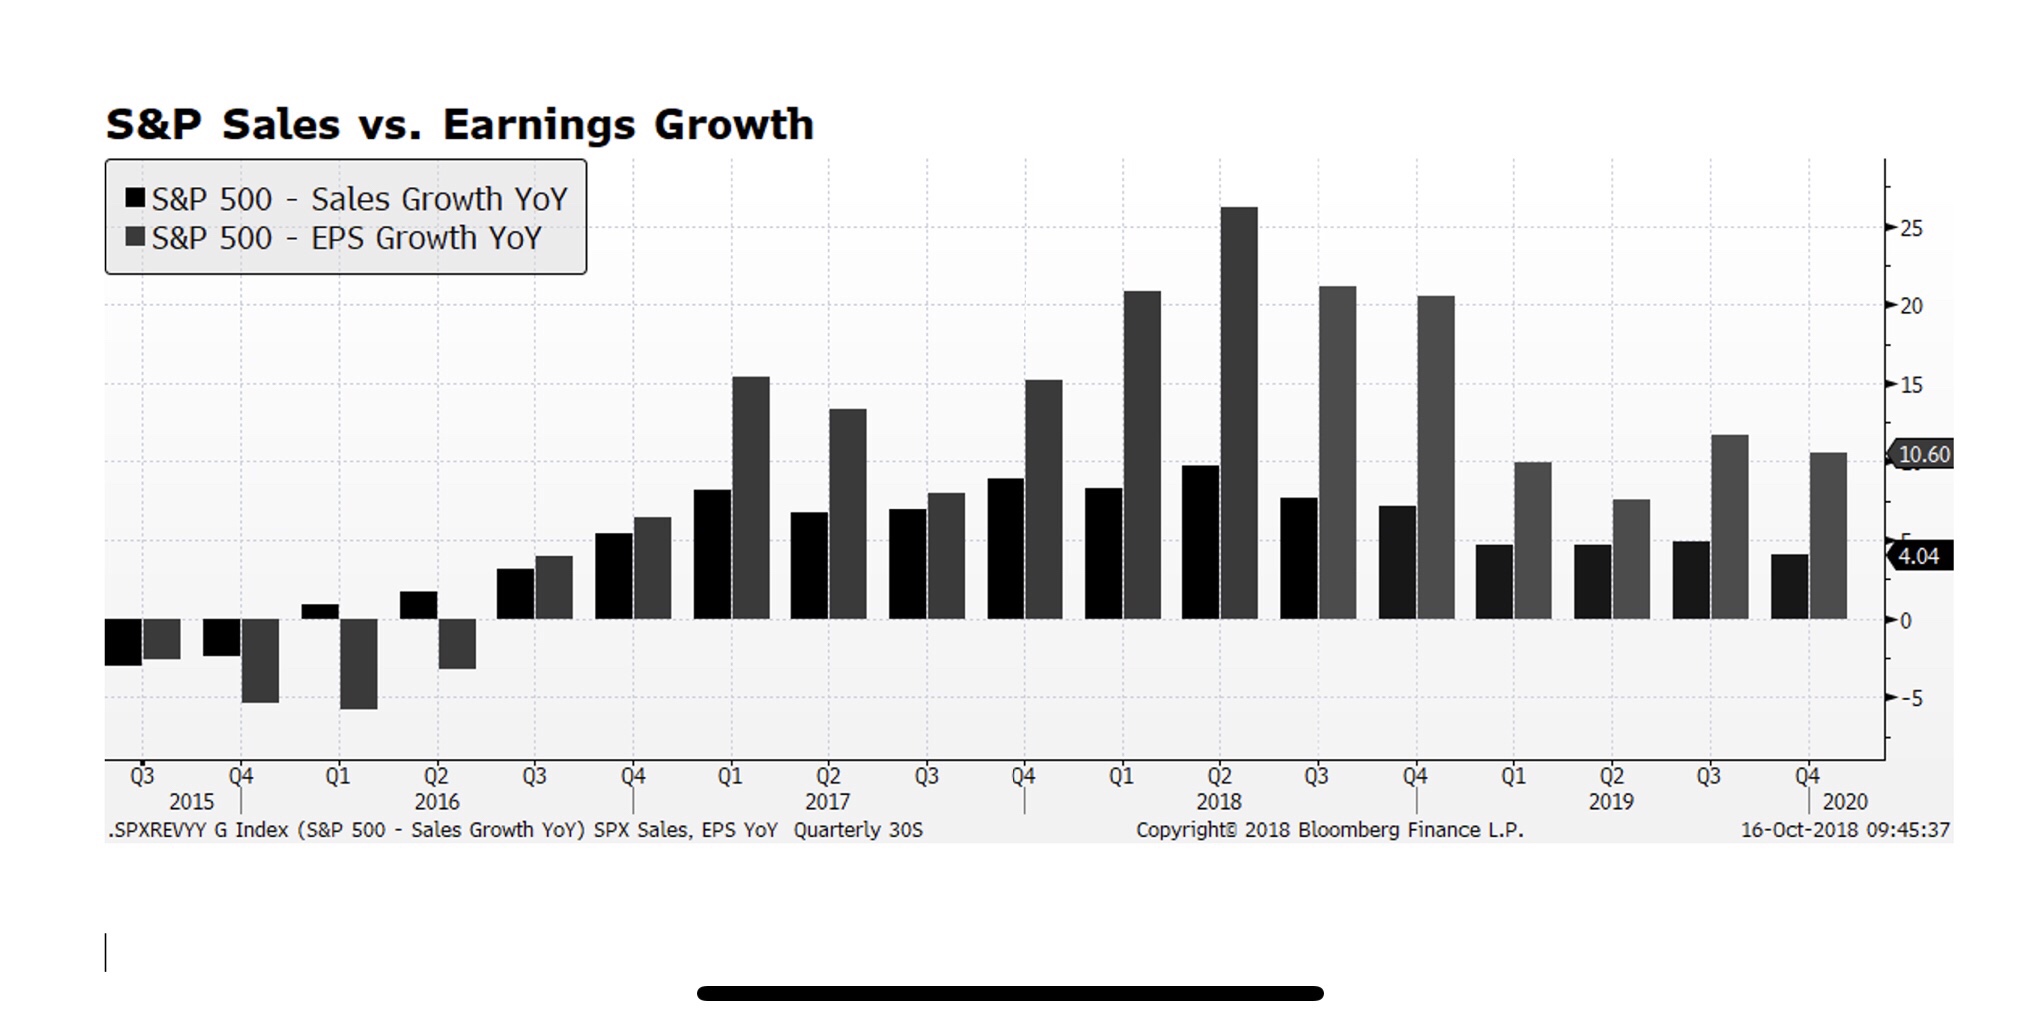
Stock markets around the globe continue to be highly volatile as key indices have sharply corrected since the beginning of October. By earlier this week, the S&P 500 had declined 5.6%, the Eurostoxx 600 had fallen 6.4%, the Nikkei contracted 6.3% and the MSCI Emerging Markets index had shed an additional 7.3% through the close on October 15th. As earnings season progresses, we are seeing positive results from major US financial institutions which are welcomed signs. Bigger picture, analyst expectations for future earnings and sales growth into 2019 and beyond (this week’s chart and admittedly an extension of last week’s) signal further expansion. The risk may be to the upside as strong US economic trends could propel sales and earnings above expectations. However, there are considerable risks at home with upcoming national elections and upward interest rate trends as well as challenging economic conditions in several key international regions.

WCM Chart of the Week for Oct. 10, 2018

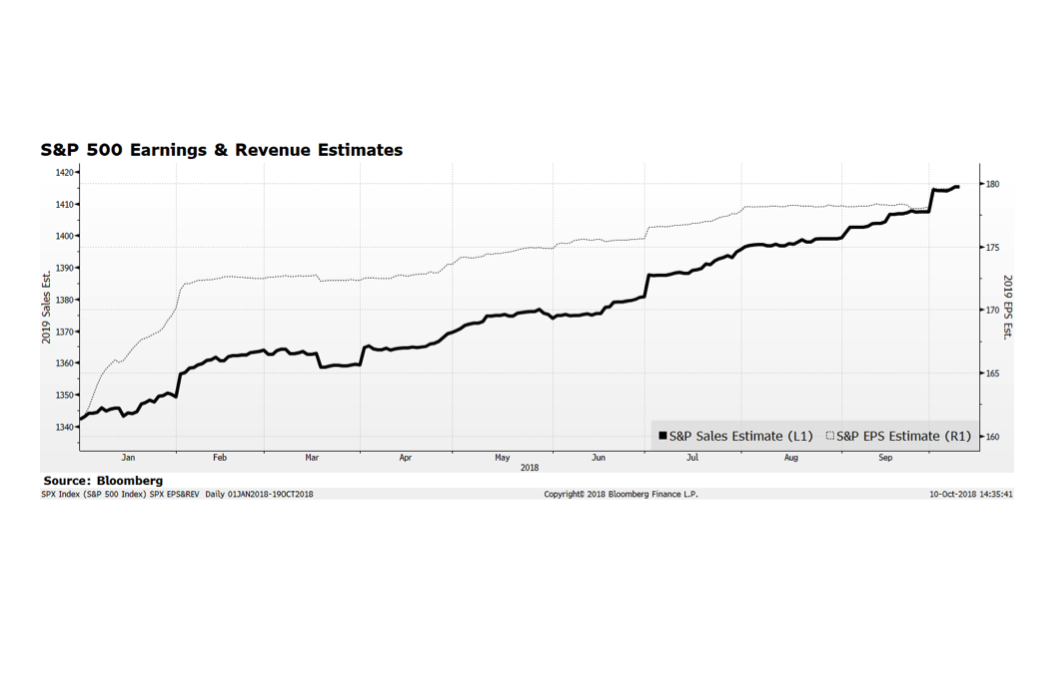
International stock markets have been weak for several quarters measured in US dollar terms and it appears that may be affecting the US stock market. As of tonight’s (October 10th) close the S&P 500 has contracted 4.9% from its all time high reached on September 20 with most damage occurring in the past six days of trading. Today alone accounted for 94 points of the 144 point decline in the S&P price level. While the pain has been deep and swift as the market adjusts to a higher interest rate environment, economic trends remain supportive of further earnings, revenue and market gains. This week’s chart shows analyst expectations for S&P 500 earnings and sales levels, and it does not appear that the upward advance is rolling over or stagnating. That could change as earnings season arrives but, for the time being we view this sell-off as a bull market consolidation.

If you enjoy the COTW, don’t forget to follow us on Instagram [@wildecapitalmanagement2016], Facebook [@wildecapitalmgmt], and LinkedIn.

Open hiring and unlocking the value of human capital

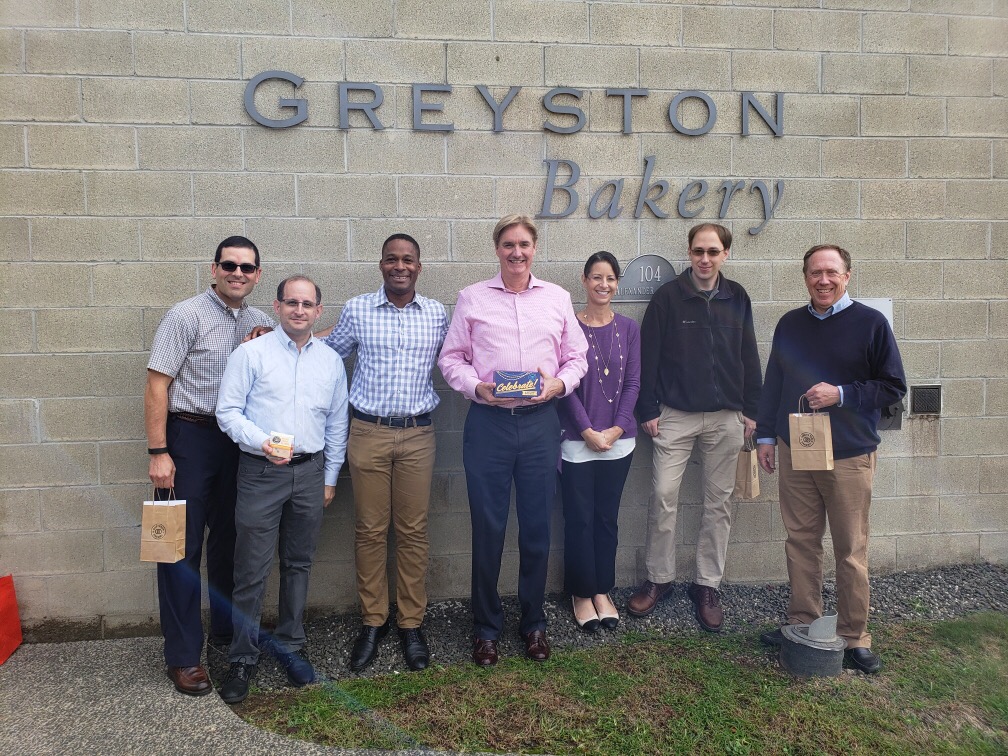
Profoundly grateful for and inspired by the time and insight the team at Greyston Bakery (@greystonbakery) in Yonkers, NY shared with us. Aside from turning out great brownies under their artisanal label as well as for Ben & Jerry’s, they lead the way in how they think about human capital and the means to staff a very loyal and effective work force and also create tangible social change through economic empowerment. Through their open hiring process, anybody can come apply for a job, and the application is little more than name, address, phone number, email address and what interests you. No pre-qualifications, no background checks, no work histories. Just ready to learn and to work. Even better, they assist their workers with the challenges that face many people in many companies, from childcare and transportation issues to alcohol and drug dependence challenges. They truly embody sustainable business in all parts of the value chain from fair trade suppliers to truly engaged personnel recruitment and management. Check them out at greyston.org, or in a pint of B&J’s Chocolate Fudge Brownie. The best way to conduct ESG research on a company’s supply chain! Special thanks to Joseph Kenner for hosting, and our friends at Conscious Capital Wealth Management for making arrangements.

WCM Chart of the Week for Oct. 5, 2018

A little late with this week’s chart, but the last couple days have been critical in making this point — With interest rate spreads reaching levels that investors have not witnessed since the pre-crisis era, and in the case of Europe all-time wide measures, some wonder if this may be a precursor to an imminent market event. This cycle may be different. The US Federal Reserve will likely remain highly transparent as they reach what they consider to be neutral policy rates several quarters out. The wild card could be the ECB, and their interest rate trajectory and QE management in what we view as a fragile economic environment. Our sense is that central banks will tread very carefully as they manage policy rates upward, keeping in mind the precarious global economic state. The risk, from our perspective, is that further out, extensive monetary policy may create another adverse market event.

WCM Chart of the Week for Sept. 26, 2018

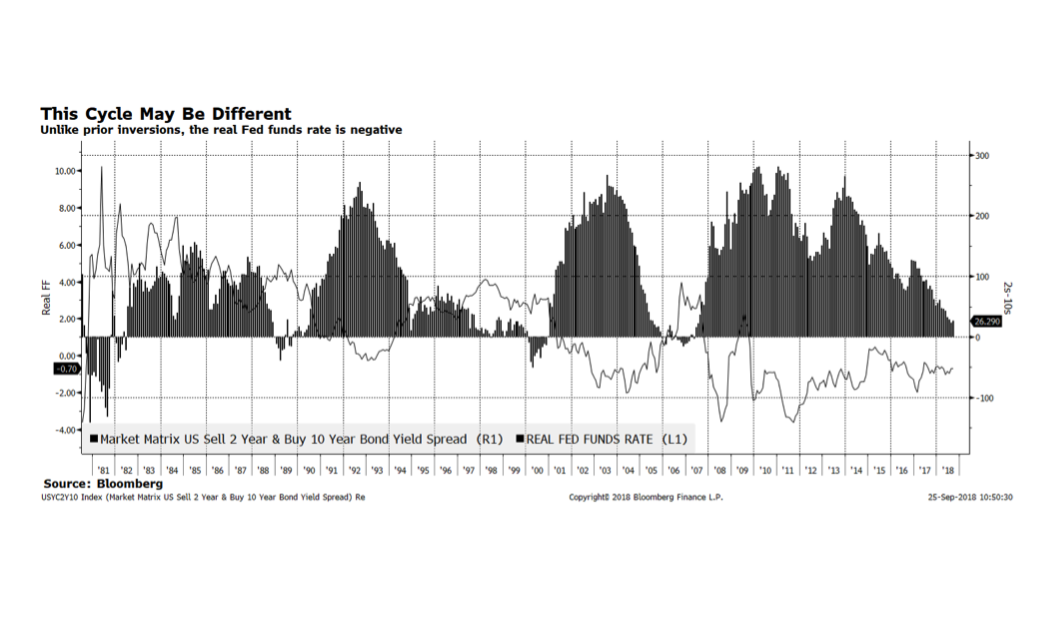
Interest rates have been of paramount concern for investors for several years given extremely low, and in some cases negative, levels in much of the developed world. The yield on the 10-year US Treasury has recently pierced the 3% level and now stands at 3.1%. The US Federal Reserve is poised to raise the upper band of the fed funds rate another 25 basis points to 2.25% on September 26 and many Fed watchers expect the central bank to continue raising rates until at least June 2019. Market participants are concerned that Fed activity will ultimately lead to an inversion of the yield curve and when that has occurred in past cycles, recessions often have followed. What is different this cycle is that the real federal funds rate is negative due to the Fed’s highly accommodative policy stance and, as shown in this week’s chart, have only experienced a yield curve inversion when the real fed funds rate is in positive territory.

There are many other factors that may influence this relationship and a considerable force, in our opinion, is central bank policy and the direction of interest rates in the rest of the world. In August, the Bank of England raised their policy rate to the highest level since the financial crisis and the European Central Bank may begin to raise borrowing costs by the end of this year.

« Older posts Newer posts »